$BTC the current technical landscape for BTC/USD as of mid-April 2026 suggests definitive shift in market structure. After a lengthy consolidation phase,the price action is now signaling the start of fresh bullish cycle.
Technical Outlook;
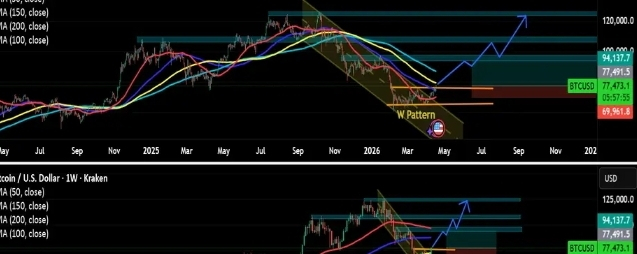
-weekly chart (macro perspective):the breakout from the descending parallel channel serves as a major bullish catalyst.by slicing through the upper boundary near $74,000.bitcoin has effectively neutralized months of bearish pressure,suggesting the start of a new impulsive wave.
-daily chart (reversal pattern):a classic "W"pattern (double bottom)has fully formed.the price currently breakout above the $76,000 neckline;a sustained daily close above this level would flip previous resistance into support and confirm a macro trend reversal.
-momentum indicators:the weekly RSI is currently hovering near 45,positioned well below the overbought threshold (70+).this indicates significant "runway "for price appreciation,provided a strong tailwind for a multi-week swing trade toward higher targets.
-Trade plan and Risk management:this setup offer the structured approach to capturing the trend while protecting capital.
☆Entrey price:$77,400 price as of April 17,2026.
♤profit Targets:
-Target 1:$94,000
-Target 2:$106,500
-Target 3:$123,700