Market Analysis · May 13, 2026
BTC/USDT
Daily Chart Breakdown
A comprehensive technical analysis of Bitcoin's price structure, key levels, and a$BTC ctionable strategy for spot traders.
Pair BTC/USDT
Timeframe 1D (Daily)
Exchange Binance
Type Spot Only
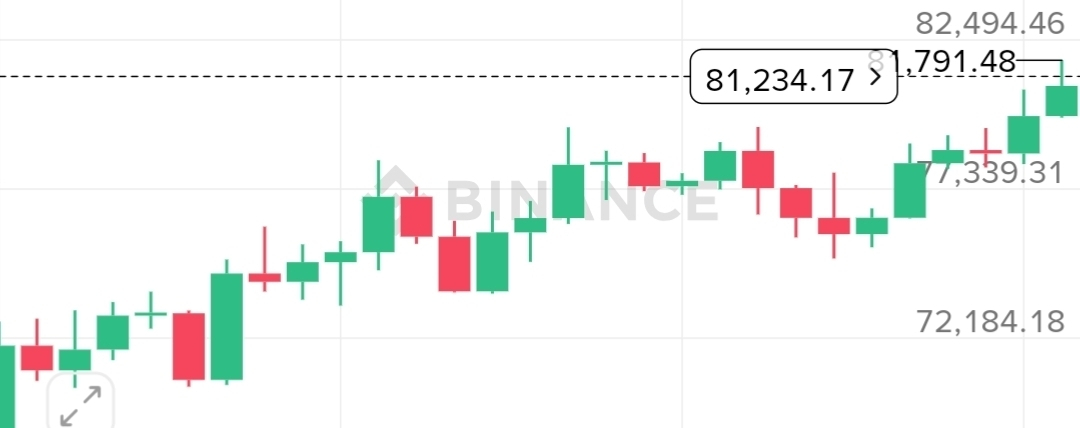
Current Price
$81,234.17
30D Low
$67,732.01
Recent High
$82,850.00
📈The Big Picture — What Happened?
Bitcoin experienced a significant recovery over the past month. After hitting a local bottom around $67,732 in early April 2026, BTC mounted a strong bullish rally, climbing all the way to $82,850 — a gain of approximately 22% in under 30 days.
This recovery was marked by a series of strong green daily candles through April 7–19, signaling aggressive buying pressure returning to the market. The move was sustained and methodical — not a single explosive spike, but a staircase of higher highs and higher lows, which is a hallmark of genuine trend recovery.
✅ Bullish Trend Confirmed
BTC has printed a clear sequence of higher lows since April 7. The overall daily structure is bullish. Any pullback should be viewed as an opportunity, not a reversal — unless key support levels break.
🕯️Candlestick Behavior
Phase 1: The Rally (April 7–19)
Strong, full-bodied green candles with small wicks dominated this phase. This pattern indicates buyers were firmly in control — any attempt by sellers to push prices down was quickly absorbed. Volume confirmation would strengthen this read further.
Phase 2: Consolidation (April 25 – May 5)
After reaching $82,850, the market entered a period of consolidation. Mixed red and green candles with relatively small bodies appeared — a classic sign of indecision between buyers and sellers at a key resistance zone. Doji-like candles near the top suggest the market was digesting its gains.
Phase 3: Now (May 13)
Price has pulled back to $81,234, sitting comfortably above the $79,960 support zone. This is a healthy correction — not a breakdown. The market is simply cooling off before its next move.
⚠️ Current Condition: Bullish Consolidation
Price is in a tight range between $79,960 support and $82,850 resistance. A breakout above $82,850 would signal continuation. A breakdown below $79,960 warrants caution.
🎯Key Price Levels
These are the levels every BTC trader should have on their screen right now:
🔴 Resistance Zones
$82,850
Recent high
$82,494
Upper range
$83,306
Chart ceiling
🟢 Support Zones
$79,960
Key support
$77,339
Strong floor
$73,724
Major support
💡Trading Strategy
Based on the current chart structure, here are three clearly defined scenarios with corresponding actions for spot traders:
🟢 Scenario A — Price Holds $79,960
If Bitcoin respects the $79,960 support level and begins to bounce, this is your entry signal. The risk/reward here is favorable.
Entry Zone : $79,000 – $80,500
Target 1 : $82,500
Target 2 : $83,306
Stop Loss : $77,500
Est. Gain : ~3–4%
🔴 Scenario B — Price Breaks $79,960
If the $79,960 support fails with a strong daily close below it, do not buy the dip immediately. Wait for the next level to hold.
Action : WAIT — do not buy
Watch For : $77,339 reaction
Re-Entry : Only after bounce confirmed
Risk : High if forced
💎 Scenario C — Breakout Above $82,850
If BTC closes a daily candle convincingly above $82,850 with momentum, that signals the next leg up is beginning.
Entry : $82,900 on confirmed breakout
Target : $85,000 – $88,000
Stop Loss : $81,000
Signal : Strong bullish continuation
📊Overall Market Scorecard
Factor Reading Signal
Daily Trend Higher highs, higher lows ✅ Bullish
30-Day Performance +22% from $67K ✅ Strong
Current Pullback ~2% from recent high ⚠️ Normal
Key Support $79,960 holding ✅ Intact
Resistance $82,850 not yet broken ⚠️ Watch
Entry Timing Slightly extended ⚠️ Wait for dip
Overall Verdict
Cautiously Bullish
The trend is up. The structure is healthy. But chasing price at current levels is risky — patience is the real edge here. Wait for $79,960–$80,500 for a safer entry, or for a confirmed breakout above $82,850.
📝Key Takeaways for Beginners
If you are new to trading, here is what this analysis means in simple terms:
Bitcoin is in an uptrend — the overall direction is positive. It went from $67K to $82K in a month, which is impressive. But it cannot go up in a straight line forever. The current small dip is the market catching its breath.
Do not rush. The biggest mistake beginners make is buying because they fear missing out. There will always be another opportunity. If the price drops to $79,000–$80,000, that is a much safer place to buy than chasing it at $81,000+.
Never use leverage. Spot trading only — buy the actual asset and hold it. This keeps your risk defined and your conscience clear for halal investing.
Use stop-losses. Decide before you enter — at what price will you accept that you were wrong and exit? Setting this in advance removes emotion from the equation.
⚠️ DISCLAIMER: This article is for educational and informational purposes only. It does not constitute financial advice. Cryptocurrency trading involves significant risk of loss. Always do your own research before making any investment decisions. Past price performance is not indicative of future results.#BinanceOnline #SchwabOpensCryptoAccounts #ClarityActDraft #JPMorganEthereumTokenizedFund
