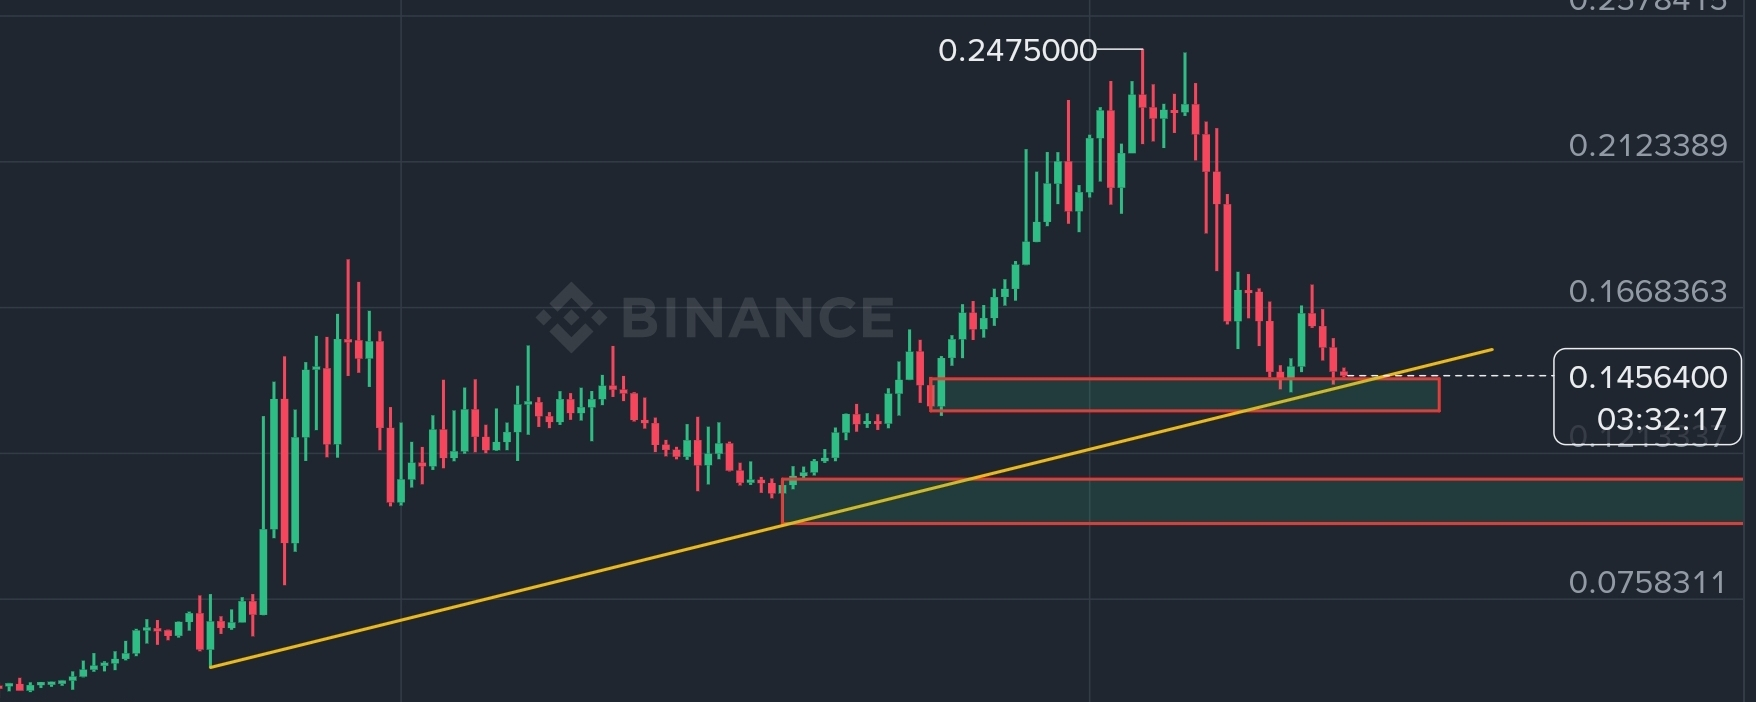
UBUSDT on the 4h chart is testing a key point at 0.1456. Price ran up from 0.0406 to a high of 0.2475 and has been correcting since, now sitting right on the rising trendline that’s been supporting the move since the bottom.
That trendline is lining up with a horizontal demand zone between 0.13 and 0.14. This is the same area that acted as resistance before and now it’s flipping to support. If buyers hold here, it keeps the higher low structure intact and opens the path back toward 0.1668 and then 0.2123. A reclaim of 0.1668 would be the first sign that the correction is losing steam.
If this zone fails, the next major level is down near 0.0758. That’s where the previous base formed before the breakout, and it’s the last line before the structure shifts to lower highs. Right now the chart is in a wait and see spot.
Volume has dried up during the drop, which is normal for a retest, but what matters next is how price reacts at this trendline. A bounce with volume puts UB back in play for a continuation. A clean break below would likely lead to a deeper retrace before any real demand shows up again.
So the focus is simple. Hold 0.13 to 0.14 and the uptrend stays alive. Lose it and the market likely resets lower to find the next bid.
Trade from here before DYOR 👇
