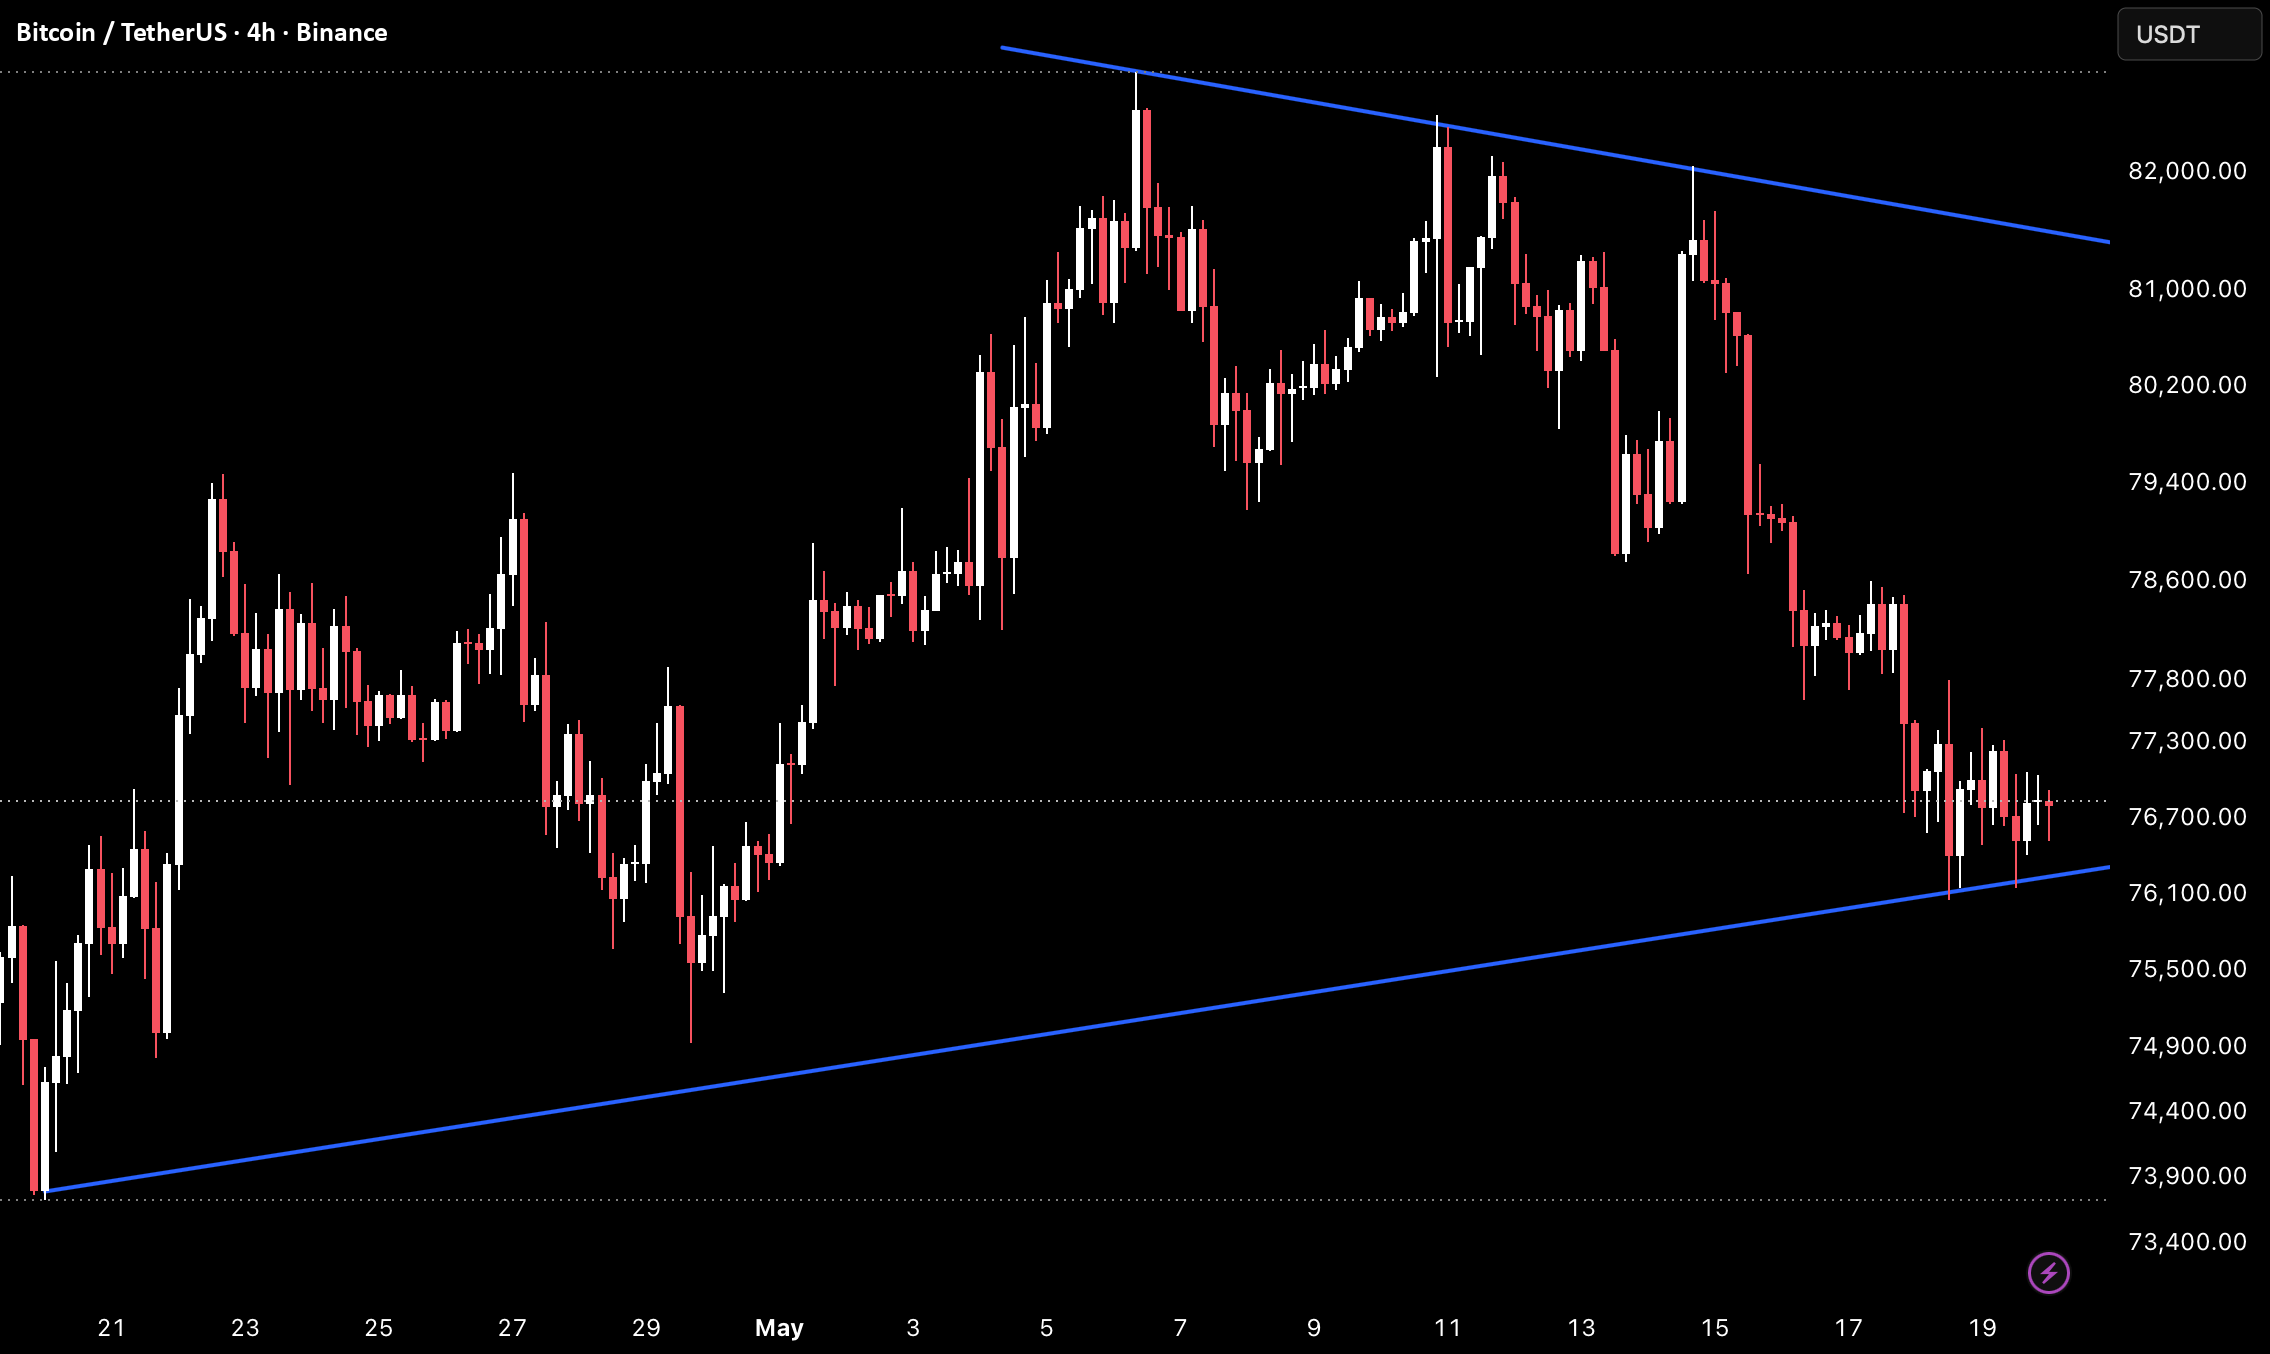

Bitcoin on the 4H timeframe is currently trading around 76,841 while compressing inside a structure formed by a descending resistance trendline from the May highs near 83,000 and a rising support trendline from the April lows near 73,400.
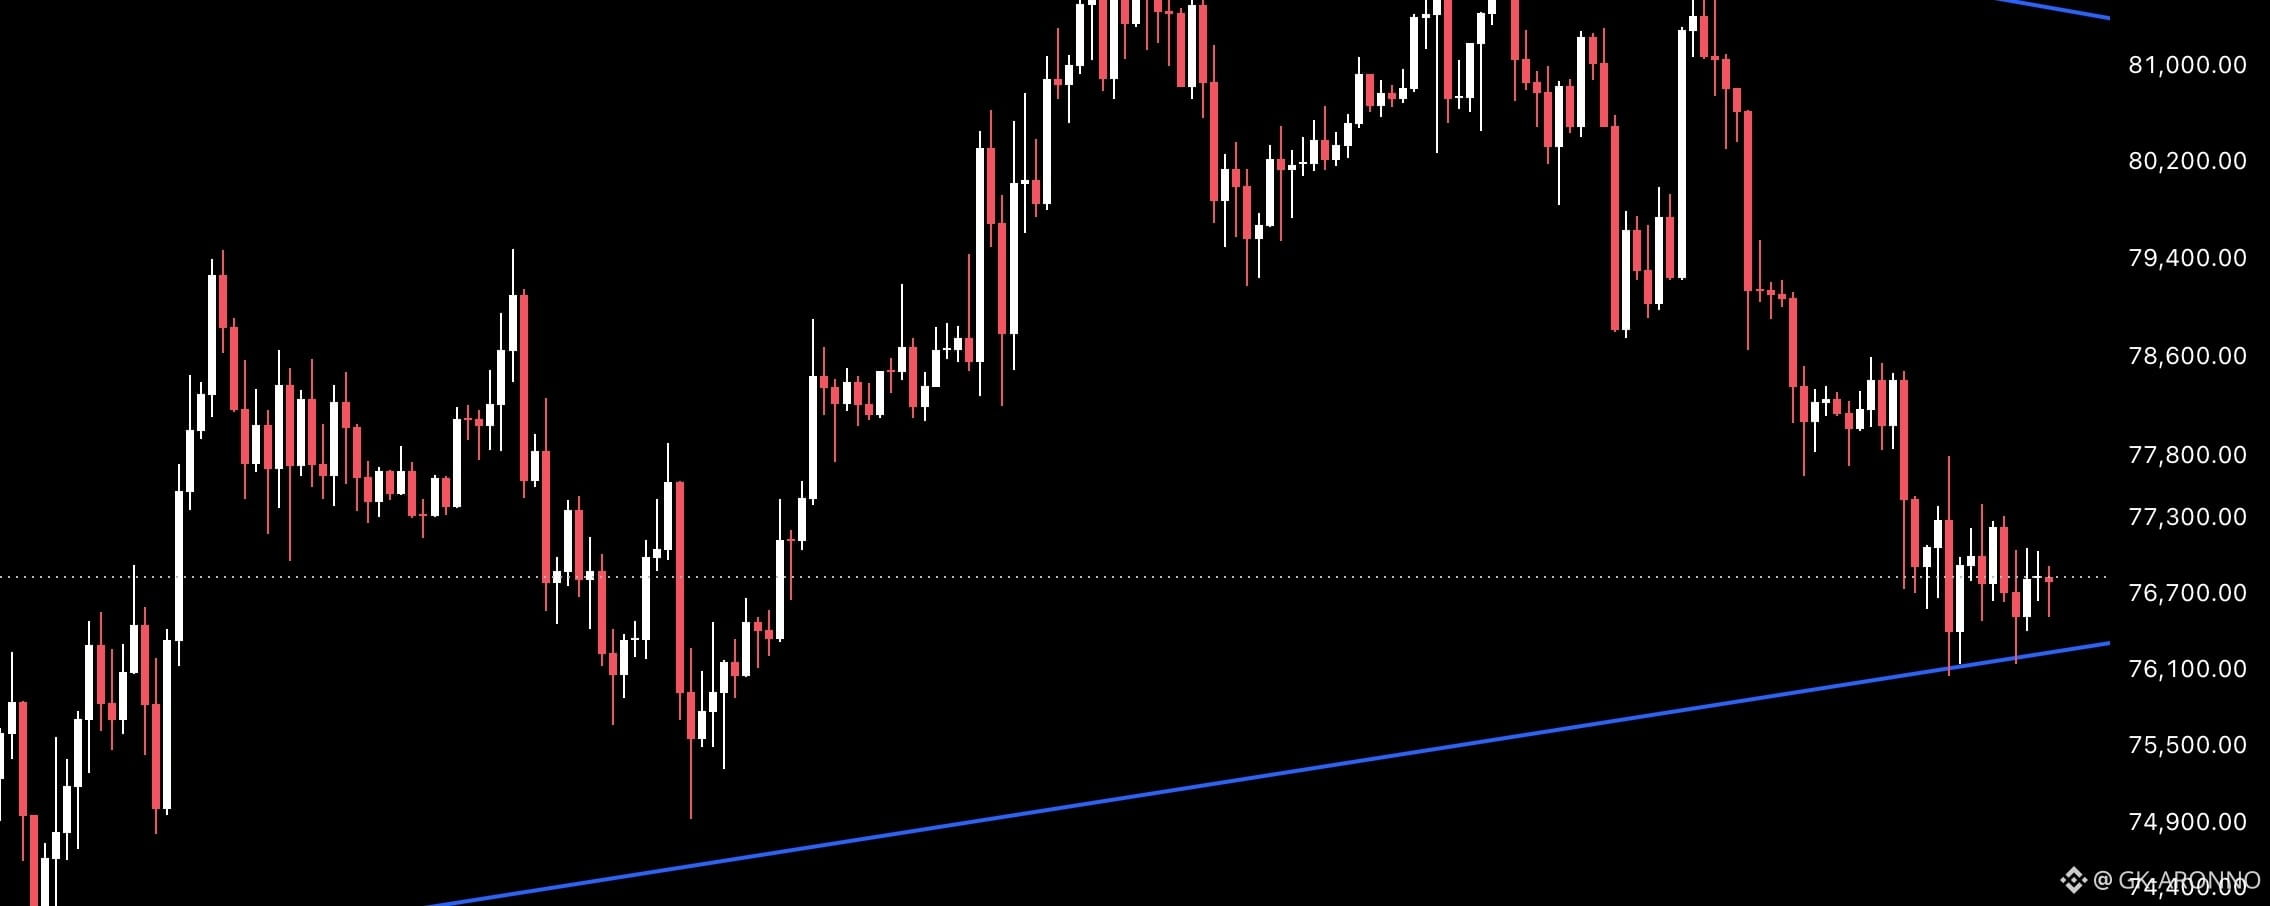
Price pushed up to the descending resistance near 82,000–83,000 twice before being rejected both times. It has since sold off sharply and is now sitting directly on the rising trendline near 76,000–76,200, which is the most important support level on this chart.
The horizontal support zone near 76,800–77,000 has also been tested multiple times and is now being pressured from above.
Key Levels To Watch
82,000–83,000 → Descending resistance trendline, upper boundary
79,400–80,200 → Prior support zone, now resistance
77,800–78,600 → Mid-range resistance above
76,800–77,000 → Horizontal support, current area
76,000–76,200 → Rising trendline support, critical level
Below 73,400 → Full structure breakdown
The rising trendline has held as the macro floor since the April lows and is now being tested directly. Price is sitting in the most critical zone of this compression structure.
A hold at the rising trendline near 76,000–76,200 would keep the compression intact and set up a potential recovery toward the descending resistance.
A confirmed breakdown below the rising trendline would resolve the structure bearishly and open room toward 74,400–74,900 and potentially the April lows near 73,400.
This is the most critical test in the current structure.
Hold rising trendline at 76,000–76,200 → compression intact, recovery toward 79,000–82,000.
Lose trendline → breakdown confirmed, eyes on 74,400–73,400.
Neutral inside compression.
Bias only on confirmed trendline hold or breakdown.