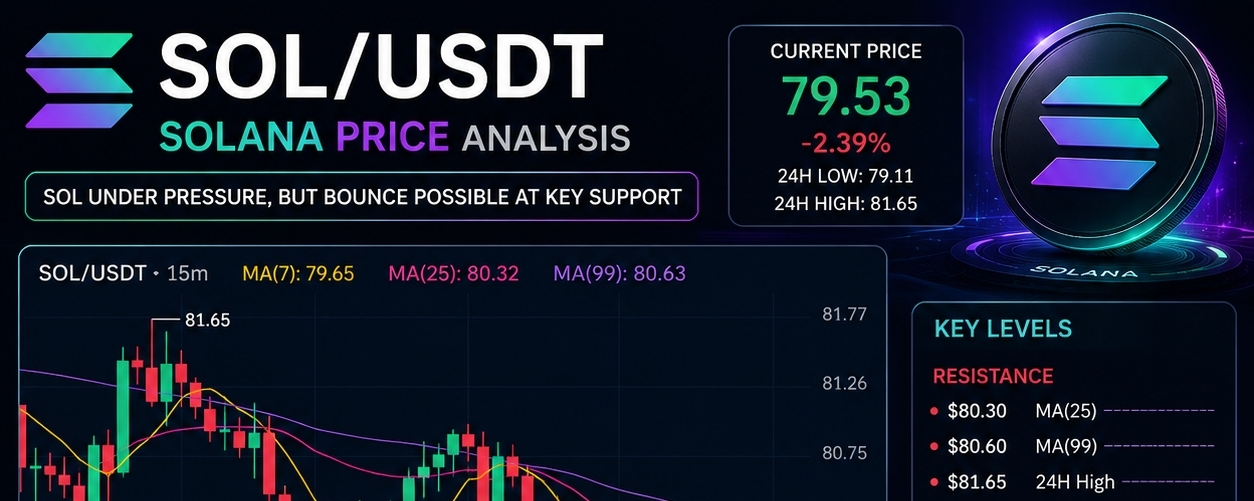
$SOL The latest 15-minute SOL/USDT chart shows a market that has clearly lost short-term momentum. After reaching a local high near **$81.65**, Solana has experienced a steady decline, pushing the price back toward the **$79.30-$79.50** support area.

At first glance, the chart appears bearish. However, a closer look reveals that the market may be approaching an important decision point.
## What the Chart Is Telling Us
The most obvious observation is the sequence of **lower highs and lower lows**, a classic sign of short-term bearish control.
Price is currently trading below:
* MA(7)
* MA(25)
* MA(99)
This alignment suggests that sellers still have the advantage across multiple short-term timeframes.
The inability of buyers to reclaim the moving averages indicates that every relief rally is currently being sold into rather than extended higher.
## The Importance of the $79.30 Support
The most interesting area on the chart is around **$79.30**.
After the sharp decline, buyers stepped in several times near this level, preventing a deeper breakdown.
Support levels become important because they reveal where market participants believe value exists.
As long as SOL remains above this zone, the possibility of a short-term recovery remains alive.
However, if support fails, sellers may target lower liquidity zones and accelerate the downside move.
## Order Book Signals
One encouraging sign for bulls is the order book.
Current bid dominance appears stronger than asks, suggesting that buyers are actively defending current prices.
While order books can change quickly, they often provide clues about short-term market sentiment.
For now, buyers seem willing to absorb selling pressure around the current range.
## Why Traders Should Watch the Moving Averages
The MA(25) near **$80.32** and the MA(99) near **$80.63** have become key resistance levels.
For a meaningful bullish recovery, SOL must:
✔ Reclaim $80.30
✔ Break above $80.60
✔ Hold those levels as support
Without this confirmation, any upward move may simply be another temporary bounce within a broader downtrend.
## Bullish Scenario
If buyers successfully defend the current support zone and volume increases:
* SOL could retest $80.30
* Then challenge $80.60
* A breakout above $81.00 could shift momentum back in favor of the bulls
A strong recovery would likely require Bitcoin and the broader crypto market to remain stable.
## Bearish Scenario
If support near $79.30 breaks:
* Selling pressure could intensify
* Stop losses may get triggered
* SOL could search for lower support levels before attracting fresh buyers
This would confirm that sellers remain firmly in control of the short-term trend.
## What I'm Watching
Instead of predicting direction, I'm focused on reaction.
Questions that matter:
* Can buyers continue defending $79.30?
* Does volume increase on green candles?
* Can price reclaim the MA(25) and MA(99)?
* Is the next breakout accepted or immediately rejected?
The answers to these questions will likely determine Solana's next meaningful move.
## Final Thoughts
SOL currently sits at a critical area where both buyers and sellers have reasons to act.
The trend remains bearish in the short term, but support has not yet been broken.
Markets often look weakest right before a relief rally and strongest right before a correction.
For now, patience may be the most valuable position.
T
he next move isn't about prediction.
It's about watching which side wins the battle around $79.30.