
As of June 15, 2026, XRP trades at $1.18, a level that appears deceptively calm. The ripple price today reflects a genuine tug-of-war between timeframes, with the daily chart firmly bearish and the hourly chart showing short-term momentum inside a broader structure still controlled by sellers.
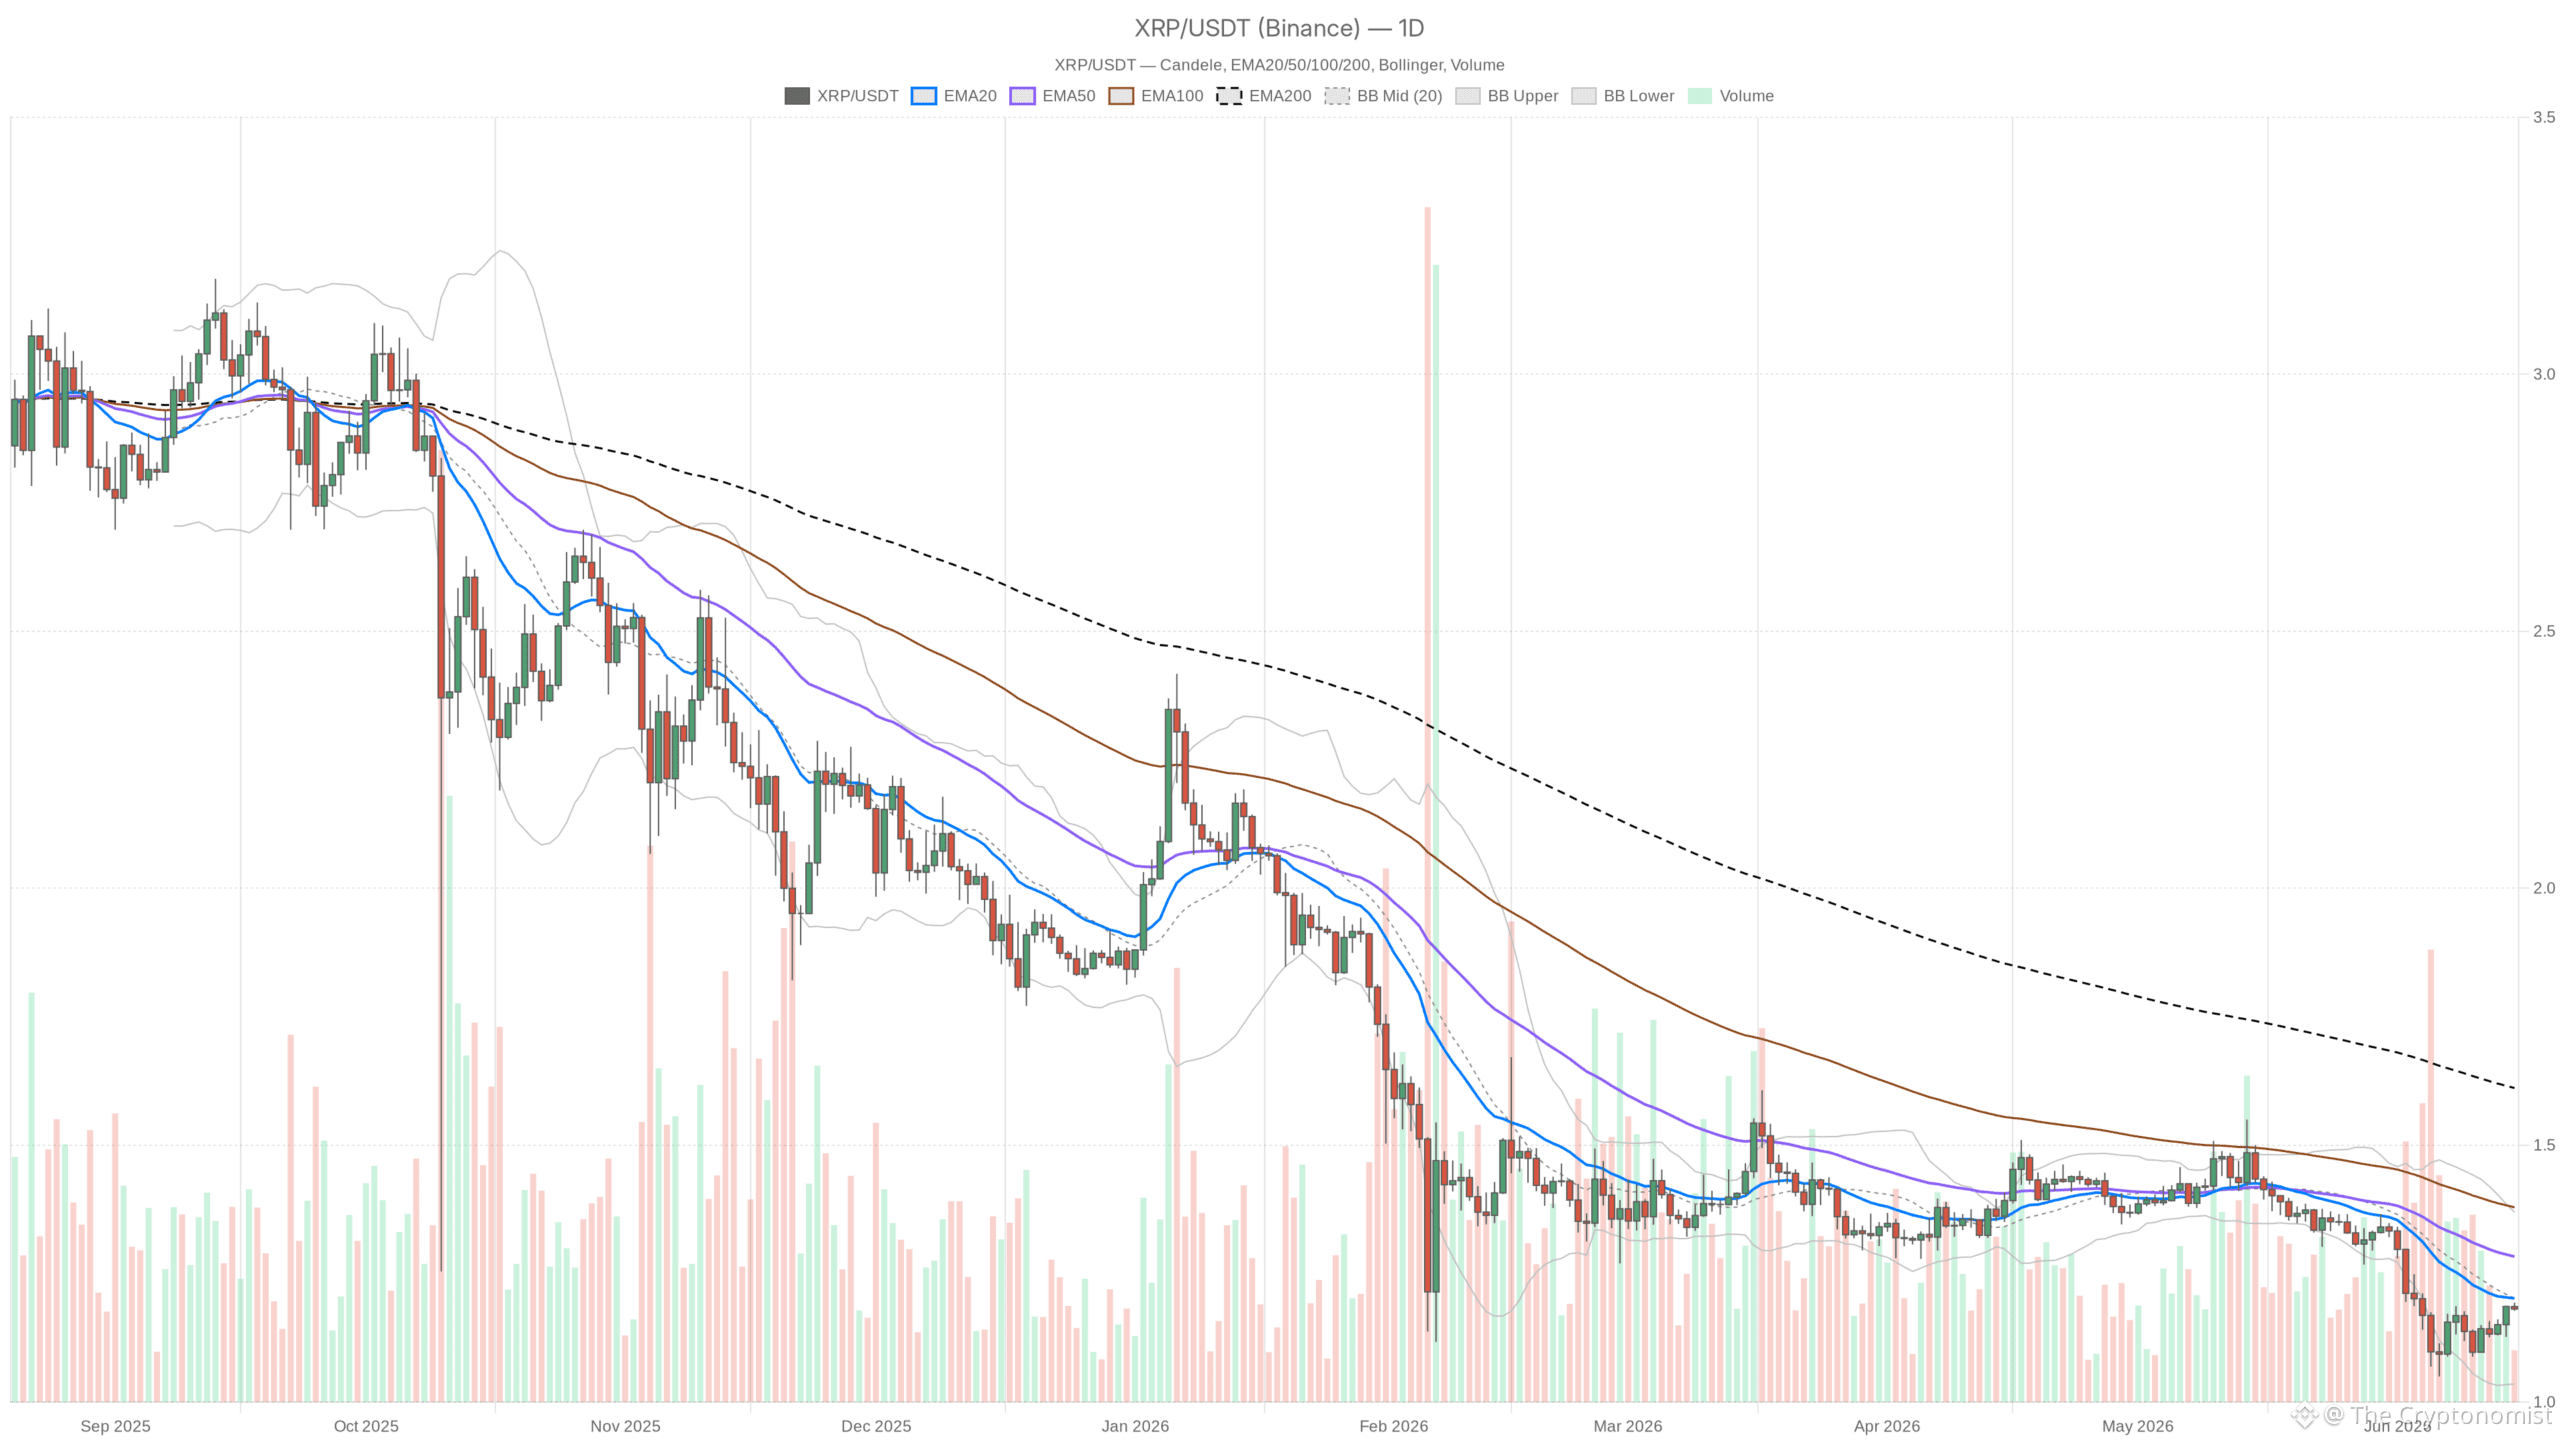 XRP/USDT — daily chart with candlesticks, EMA20/EMA50 and volume.
Key takeaways
XRP trades at $1.18, below all major daily moving averages, with the 200-day EMA sitting 36% higher at $1.61.
Daily RSI at 43.31 signals persistent weakness without reaching oversold extremes that typically precede reversals.
The hourly chart shows a bullish short-term structure with RSI near 68, approaching overbought territory.
Fear & Greed Index at 20 (Extreme Fear) limits the potential for sustained demand across the crypto market.
Key levels to watch: support at $1.17, resistance at $1.20–$1.21, with a downside target at $1.04.
The broader crypto market, despite a modest 1.9% total market cap gain in the last 24 hours per CoinGecko figures, is doing so under a Fear & Greed Index reading of just 20 — deep into Extreme Fear territory. That macro emotional backdrop matters. Recoveries attempted in fearful markets tend to be shallow and easily reversed, and XRP’s technical structure offers no reason to assume this one will be different. What makes this moment worth examining is the divergence between what the daily chart is saying and what the hourly timeframe is doing.
The short-term picture has real, measurable momentum, but it is being generated inside a larger structure that still belongs to the sellers. Whether this represents genuine base-building or simply a dead-cat bounce finding resistance is the core question every XRP trader should be sitting with right now.
The Daily Frame: Bearish Until Proven Otherwise
On the daily chart, the price action is unambiguous. XRP at $1.18 sits below its 20-day EMA at $1.20, below the 50-day EMA at $1.28, and well below the 200-day EMA at $1.61. That stacking of moving averages above price reflects a market that has been systematically distributing for months. Each average acts as a ceiling, not a floor. The 200-day alone, sitting more than 36% above current price, signals just how far XRP has fallen from its structural mean. Price has not simply pulled back; it has disconnected from its long-term trend entirely.
The daily RSI at 43.31 confirms the weakness without yet hitting the kind of oversold exhaustion that typically precedes meaningful reversals. That reading is stuck in no-man’s land — not distressed enough to attract contrarian buyers in size, not strong enough to suggest sellers have run out of conviction. It is the RSI of an asset drifting, not one preparing to launch.
The MACD on the daily is negative across the board: the line sits at -0.05, the signal at -0.06, and while the histogram has ticked up slightly to +0.01, that barely-positive bar is the kind of micro-relief that gets talked up by bulls and ignored by institutions. It means the rate of decline is easing, not that the decline is over.
Bollinger Bands on the daily frame tell a similar story. Price at $1.18 is trading precisely at the midpoint of the band, which sits at $1.20, with the upper band at $1.37 and the lower at $1.04. There is no compression suggesting an imminent explosive move, and sitting below the mid-band keeps the statistical bias on the downside.
A confirmed close above $1.20 would shift that bias; anything below keeps the bear camp in control. Moreover, the ATR of $0.06 gives a realistic sense of daily range. This is not a high-volatility environment right now, which makes breakouts harder to sustain and traps easier to set.
Daily pivot levels offer almost no room for optimism either. The pivot point, R1, and S1 are all essentially pinned at $1.18, $1.19, and $1.17 respectively — a cluster of levels so tight they read as a market in genuine indecision. Neither side appears willing to commit to a directional move at current prices.
The Hourly Frame: A Rally With a Ceiling
The hourly chart tells a different story, flagging a bullish short-term structure. XRP’s price at $1.18 now sits above the 20-hour EMA at $1.17, the 50-hour EMA at $1.16, and the 200-hour EMA at $1.15 — a clean bullish stack. The hourly RSI at 67.89 is elevated, approaching overbought territory, which means the intraday move has real momentum behind it.
However, that RSI reading near 68 is a double-edged signal. In a genuine uptrend, RSI can hover near overbought for extended periods. In a downtrend bounce, a reading like this tends to mark the exhaustion point before price rolls back over. Given the daily context, the second scenario deserves more weight. The hourly MACD is flat, with line and signal both at 0.01 and histogram at zero. Momentum has arrived but has not accelerated, consistent with a bounce that has run its course and now searches for a reason to extend.
The hourly Bollinger Bands place price at $1.18, sitting above the midband of $1.16 and well inside the upper band at $1.21. That $1.21 level is worth watching. A push into it would likely be sold by short-term traders who have been riding the bounce. Moreover, the lack of daily-level support above current price means any rejection there could be swift.
The 15-Minute Frame: Frozen in Place
The 15-minute chart contributes almost nothing to the directional debate right now. MACD is flat at zero, ATR is effectively zero, Bollinger Bands are pinched to a near-zero width, and RSI sits at 49 — the definition of a market that has temporarily stopped moving. This kind of compression on the execution timeframe often precedes a sharp directional move, but it gives no hint of which direction that move will take. Traders should treat the 15-minute chart as a trigger-watching tool only, not as a source of directional bias.
Market Context: Fear Is the Dominant Force
Bitcoin dominance sits at 56.6%, a level that historically signals investors rotating toward safety within crypto rather than chasing risk-on altcoins. The ripple price today operates against a backdrop where the average market participant is looking for exits, not entries. A Fear & Greed Index at 20 confirms that sentiment. Moreover, even the 1.9% uptick in total crypto market cap has not shifted that reading.
DEX volume data from DefiLlama shows single-day fee spikes across major venues like Uniswap V3, up 163%, and Fluid DEX, up 74%. However, the 7-day and 30-day trend lines remain in decline across the board. This is consistent with a market that had a busy day rather than one entering a new phase of sustained activity.
The Two Scenarios Worth Gaming Out
The bullish case requires XRP to hold above $1.17 on any pullback, use the current hourly momentum to push through the $1.20–$1.21 zone, and then convert that former resistance back into a floor. If that happens, the next meaningful target cluster sits around $1.28 — the 50-day EMA — where significant supply is likely waiting. A daily close above $1.28 with expanding volume would be the first real signal that the larger bearish structure is starting to crack. Until then, any bullish narrative remains tentative.
The bearish case is simpler and better supported by the evidence on hand. A failure to hold $1.17, or a rejection from the $1.20–$1.21 zone on the next push, would confirm the hourly recovery as exhausted. From there, the daily Bollinger Band lower boundary at $1.04 becomes the logical gravitational pull, with minimal technical support between here and there. A daily close back below the pivot cluster at $1.17 would invalidate the bullish scenario outright.
Positioning in a Market Like This
This is a market where the risk of being early dominates — not the risk of missing a move. The path of least resistance on the macro timeframe remains downward, a short-term bounce is running out of runway, and the emotional backdrop of Extreme Fear makes sustained demand difficult to generate. The volatility environment, with a daily ATR of just $0.06, is relatively compressed. However, that can change quickly if either the $1.21 resistance or the $1.17 support breaks with conviction.
Traders already positioned long from lower levels face a natural decision point near $1.20–$1.21: whether to take partial profits into resistance or trust the hourly momentum to carry further. Those watching from the sidelines have the luxury of clarity — they can wait for the daily chart to give a clearer signal before committing capital. Nothing about the current setup demands urgency. When timeframes are this conflicted, patience is the most defensible position.
FAQ
What is XRP’s price today and what are the key levels to watch?
XRP is trading at $1.18 as of June 15, 2026. The critical support level sits at $1.17, while resistance stands at the $1.20–$1.21 zone. A break above $1.21 could open the path toward the 50-day EMA at $1.28, while a failure at $1.17 would expose the daily Bollinger Band lower boundary at $1.04.
Is XRP’s current trend bullish or bearish?
The daily chart remains firmly bearish, with price trading below all major moving averages and the daily RSI at 43.31. However, the hourly chart shows a short-term bullish structure with price above the 20, 50, and 200-hour EMAs. The conflict between these two timeframes defines the current market indecision.
How does market sentiment affect XRP right now?
The Fear & Greed Index sits at 20, deep in Extreme Fear territory, which historically makes sustained rallies difficult. Bitcoin dominance at 56.6% further indicates that investors are rotating toward safety rather than chasing altcoin exposure, creating headwinds for XRP in the near term.
Disclaimer: This article is for informational purposes only and does not constitute financial advice, an investment recommendation, or a solicitation to buy or sell any financial instrument or cryptocurrency. The analysis provided is not indicative of future results. Investing in crypto assets and financial markets carries a high risk of capital loss. Always do your own research (DYOR) and consult a qualified financial advisor before making any decision.
Article produced with the assistance of artificial intelligence and reviewed by the editorial team.