
In mid-June 2026, DOGE sits at the psychologically significant $0.09 level, where daily bearish pressure collides with short-term resilience. For Dogecoin crypto, the convergence of key moving averages and sentiment indicators at this price signals a market on the verge of a decisive move.
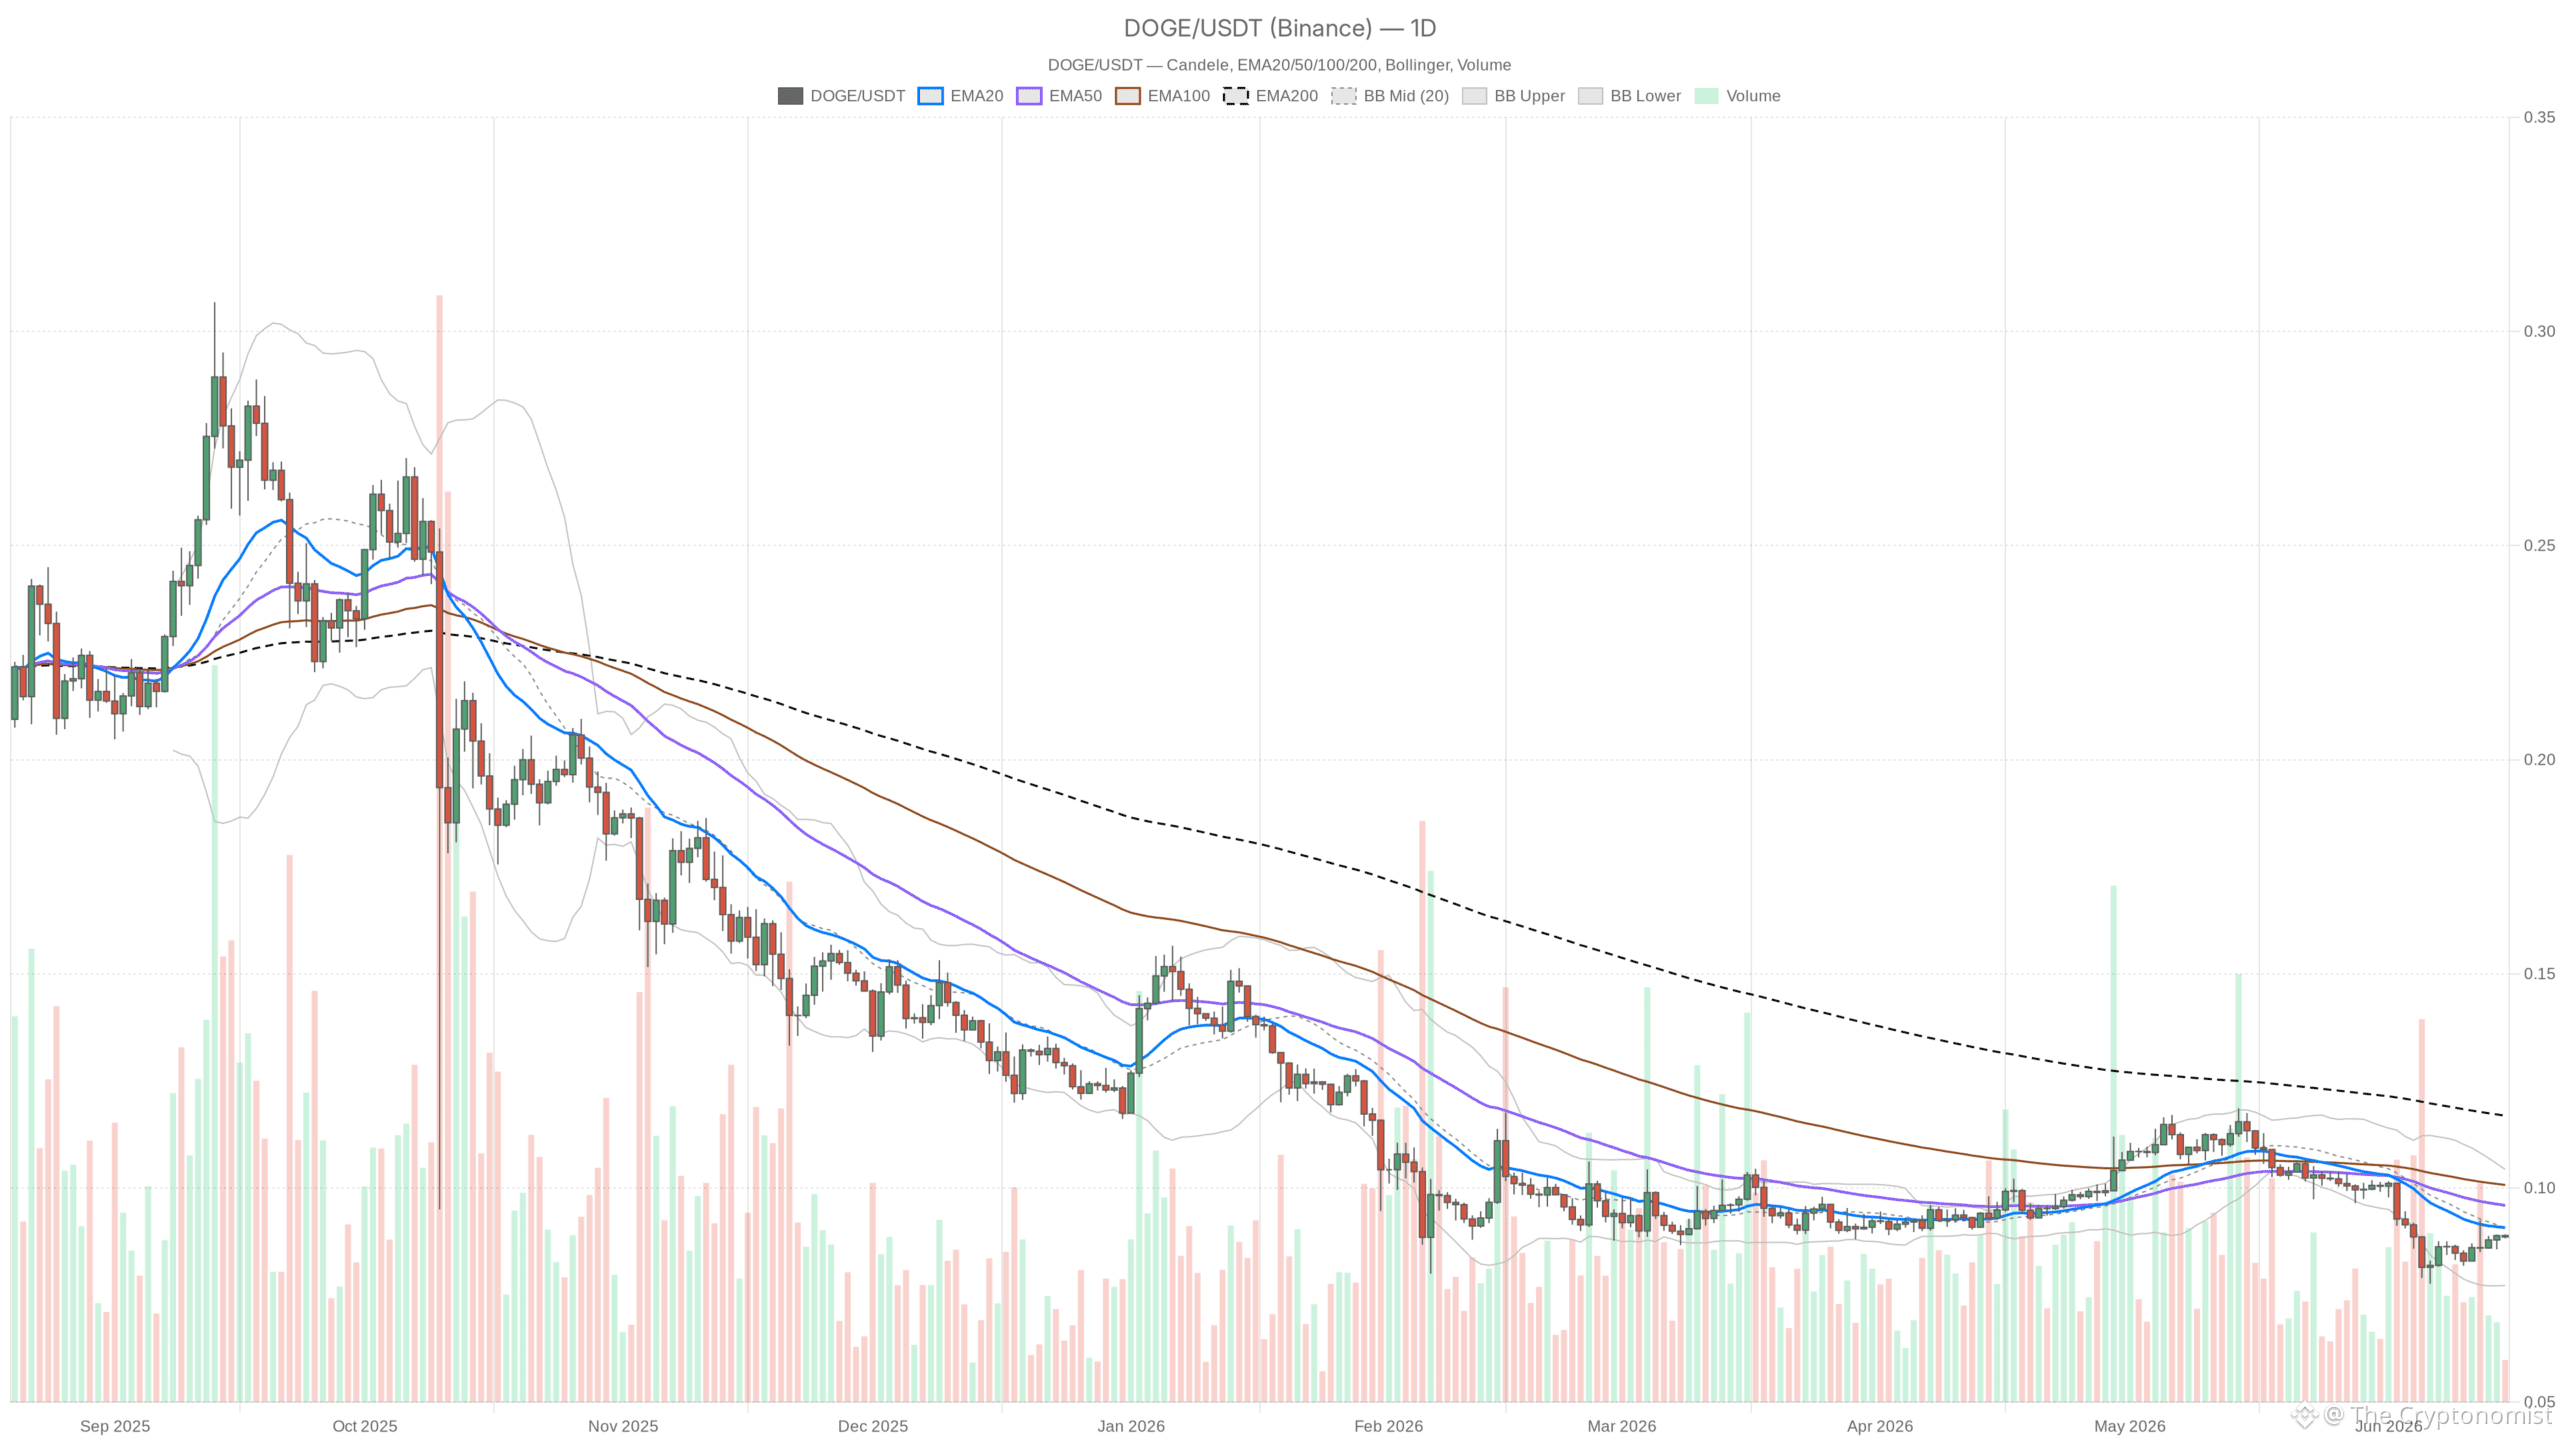 DOGE/USDT — daily chart with candlesticks, EMA20/EMA50 and volume.
Key takeaways
DOGE is pinned at $0.09, with the daily EMA20, Bollinger Band midline, and pivot support all converging at this single level.
The daily trend remains bearish, with EMA50 at $0.10 and EMA200 at $0.12 serving as heavy overhead resistance.
The hourly chart flashes short-term bullish momentum with RSI at 58.69, creating direct tension against the daily structure.
The Fear & Greed Index at 20 (Extreme Fear) and Bitcoin dominance above 56% keep risk appetite firmly suppressed across the crypto market.
A daily close below $0.08 would confirm a breakdown, while reclaiming $0.10 would begin shifting the macro trend.
The Daily Picture: A Slow Bleed Under Heavy Overhead
The daily chart paints a bearish picture, with DOGE trapped below both the EMA50 at $0.10 and the EMA200 at $0.12 — confirming a sustained downtrend that has defined price action for weeks. DOGE currently trades at $0.09, precisely on the EMA20, but that thin support is overshadowed by the heavier resistance stacked above. Those higher moving averages represent the weight of sellers who bought at elevated prices and are waiting for any relief rally to exit. Every attempt to reclaim $0.10 will collide with that wall.
The daily RSI at 41.44 lingers in the lower half of its range, below the 50 neutral line but not yet in oversold territory. That is the uncomfortable zone — it rules out a panic capitulation read yet gives bulls no meaningful momentum signal either. The market is drifting, not collapsing and not recovering. Meanwhile, the MACD on the daily sits effectively flat at zero across line, signal, and histogram, confirming the absence of any directional conviction. When MACD goes this quiet, it usually precedes a compression breakout.
The Bollinger Bands on D1 reinforce the compression narrative: midline at $0.09, upper band at $0.10, and lower band at $0.08. With an ATR of roughly $0.01, the daily range is tight but meaningful — a single strong session could push DOGE from the midline to either band. Coiled structures like this often resolve violently once a catalyst arrives. In the absence of one, however, price is simply sitting on the fence.
The Hourly Timeframe: A Flicker of Life
The hourly chart reveals a modest but genuine short-term bullish pulse. The 1H RSI at 58.69 sits above 50 and retains room to push toward 70 before hitting overbought territory, suggesting short-term buyers have held the upper hand in recent sessions. All three hourly EMAs — 20, 50, and 200 — are converged at $0.09, meaning the intraday trend is flat but not broken. There is no clean bearish waterfall on the lower timeframe, just a market catching its breath.
However, the tension between D1 bearish and H1 bullish is the central analytical challenge here. What this most likely reflects is a short-term mean-reversion bounce within a larger downtrend — the kind of move that lures in breakout buyers and then fades once the daily structure reasserts itself. It does not invalidate a potential base-building process, but it demands skepticism until daily momentum confirms a genuine shift.
15-Minute Context: Execution Noise
The 15-minute chart shows nothing more than execution noise, with RSI hovering near 47.78 and all indicators flat and compressed around $0.09. There is no actionable signal here beyond confirming that immediate price action is stuck in a holding pattern. For anyone watching entry timing, this is not a moment for anticipation — it is a moment for waiting on the break. The lower timeframes will take their cue from whichever direction the hourly and daily resolve first.
The Bullish Case — and What Would Make It Real
The bullish argument rests on Dogecoin holding the $0.09 area despite a brutal sentiment backdrop — the daily RSI has not collapsed into the 20s, and the hourly chart is showing relative strength. If the broader market sees a sentiment shift, with the Fear & Greed Index clawing back toward neutral and Bitcoin dominance pulling back from current levels, DOGE could mount a genuine attempt at the $0.10 EMA50. A clean daily close above $0.10 would start shifting the structure and put $0.12 back on the map as a medium-term target.
What would invalidate this thesis, however? A daily close below $0.08 — the lower Bollinger Band — would signal that the compression resolved to the downside and the base is broken. At that point, the next meaningful support would need to be hunted on longer-term charts, with no obvious floor until significantly lower levels.
The Bearish Case — and Where It Leads
The bearish scenario carries more structural weight at this moment. DOGE is trading below both its EMA50 and EMA200 on the daily. The macro trend points downward, and sentiment sits at Extreme Fear with no visible catalyst for reversal. Moreover, the MACD flatline is a warning, not a comfort. It means the downtrend has not accelerated, but it also means buyers have shown no conviction whatsoever.
If the $0.09 level cracks without a swift recovery, the Bollinger Band floor at $0.08 becomes the primary test, and an ATR-sized move lower from there brings $0.07 into view. The bearish case would be invalidated by a sustained reclaim of the EMA50 at $0.10 on the daily, accompanied by RSI pushing back above 50 with genuine momentum — not just a wick, but a close with follow-through.
Positioning and Risk Awareness
DOGE at $0.09 is a compressed coil, not a clear directional setup. The daily structure is bearish, the hourly is holding the line, and the market backdrop — Extreme Fear, strong Bitcoin dominance above 56%, and a broader crypto market cap near $2.32 trillion according to CoinGecko — does not favor aggressive long positioning. Consequently, anyone already holding Dogecoin needs to define precisely what a breakdown below $0.08 means for their position size and risk tolerance.
The ATR of $0.01 on the daily means DOGE can move a full cent in a single session — over 10% at current prices. In Extreme Fear environments, that volatility tends to cut downward before it recovers. Anyone considering new exposure to Dogecoin crypto should understand that entering during compression without a confirmed signal is a volatility bet, not a trend trade. The setup will clarify itself; forcing a read into a flat MACD and converged pivots is how traders get chopped up.
FAQ
What happens if Dogecoin drops below $0.08?
A daily close below $0.08 would confirm the bearish resolution of the current compression pattern, breaking the lower Bollinger Band. The next meaningful support would need to be found on longer-term charts, with $0.07 becoming the immediate target zone based on ATR-extended moves.
Is the hourly bullish signal strong enough to override the daily downtrend?
Not yet. The hourly RSI at 58.69 reflects short-term buying pressure, but without a catalyst to push DOGE above the $0.10 EMA50 on the daily timeframe, it most likely represents a mean-reversion bounce within the broader bearish structure. Confirmation requires follow-through on the daily chart.
What would confirm a genuine bullish reversal for DOGE?
A sustained daily close above the EMA50 at $0.10, accompanied by the daily RSI pushing back above 50 with conviction, would begin shifting the macro structure. If that move also sees the MACD turn positive, $0.12 becomes a realistic medium-term target.
How does the Extreme Fear reading affect Dogecoin specifically?
For a sentiment-driven asset like Dogecoin, Extreme Fear readings of 20 do not automatically signal a bottom. They indicate that market participants are withdrawing rather than engaging, which means bullish reversals require structural confirmation — not just oversold sentiment alone.
Disclaimer: This article is for informational purposes only and does not constitute financial advice, an investment recommendation, or a solicitation to buy or sell any financial instrument or cryptocurrency. The analysis provided is not indicative of future results. Investing in crypto assets and financial markets carries a high risk of capital loss. Always do your own research (DYOR) and consult a qualified financial advisor before making any decision.
Article produced with the assistance of artificial intelligence and reviewed by the editorial team.