Bitcoin is once again showing strength as price action on the **BTC/USDT daily chart** signals a clear recovery from recent lows. After weeks of consolidation and volatility, BTC has pushed back above key levels, catching the attention of traders and investors alike.
---
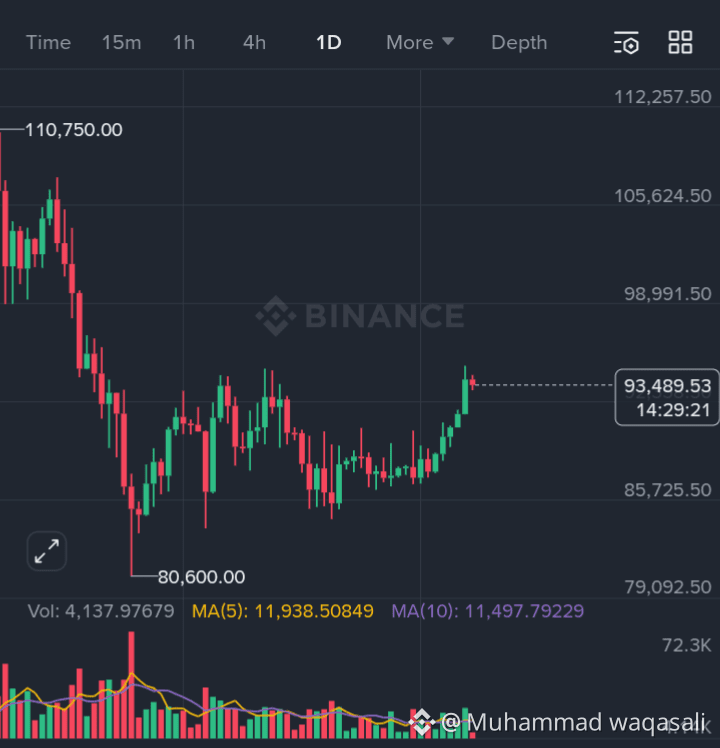
### 🔍 Market Snapshot (Binance)
* **Current Price:** $93,470
* **24H High:** $94,789
* **24H Low:** $92,407
* **24H Volume (USDT):** $1.53B
* **Daily Change:** +0.90%
---
### 📊 Technical Breakdown
After bottoming near **$83,800**, Bitcoin formed a solid base and began a steady upward move. The latest daily candles show strong bullish momentum, with price climbing sharply toward the **$94,800 resistance zone**.
Key observations:
* ✅ **Higher highs and higher lows** confirm a short-term uptrend
* ✅ Price holding **above short-term moving averages (MA 5 & MA 10)**
* ✅ Volume expansion supports the bullish move
* ⚠️ Mild rejection near $94.8K suggests short-term profit-taking
---
### 🧠 What This Means for Traders
* **Bullish Scenario:**
A clean breakout and daily close above **$95,000** could open the door toward **$98K–$100K** in the coming sessions.
* **Pullback Scenario:**
If BTC fails to hold above **$92,500–$93,000**, a healthy retracement toward **$90,500** is possible before continuation.
---
### 🔮 Market Sentiment
Despite mixed performance over longer timeframes, short-term sentiment is improving. Buyers appear confident, and dips are being absorbed quickly — a classic sign of accumulation near resistance.
---
### 📝 Final Thoughts
Bitcoin is currently at a **decision zone**. Momentum favors the bulls, but confirmation above resistance is key. Traders should watch volume and daily closes closely before making aggressive moves.
> ⚠️ *This is not financial advice. Always manage risk and do your own research.
#BTC☀️ #BTC🔥🔥🔥🔥🔥 #btcpumpanddump