In the volatile world of meme coins, dogwifhat (WIF) stands out as a Solana-based asset that has captured trader attention with its quirky branding and sharp price swings. Trading around $0.41 amid a broader market where Bitcoin experiences slight dips, WIF's recent movements suggest a potential setup for either continuation of upward momentum or a mean reversion to established ranges. As a senior crypto market analyst on Binance Square, this analysis dissects the attached chart's price action, integrates the latest three news headlines, and outlines probabilistic scenarios without offering direct investment guidance. By examining technical indicators like EMAs and Bollinger Bands alongside RSI and MACD, we uncover high-probability zones and key watchpoints for informed observation.
Market Snapshot:
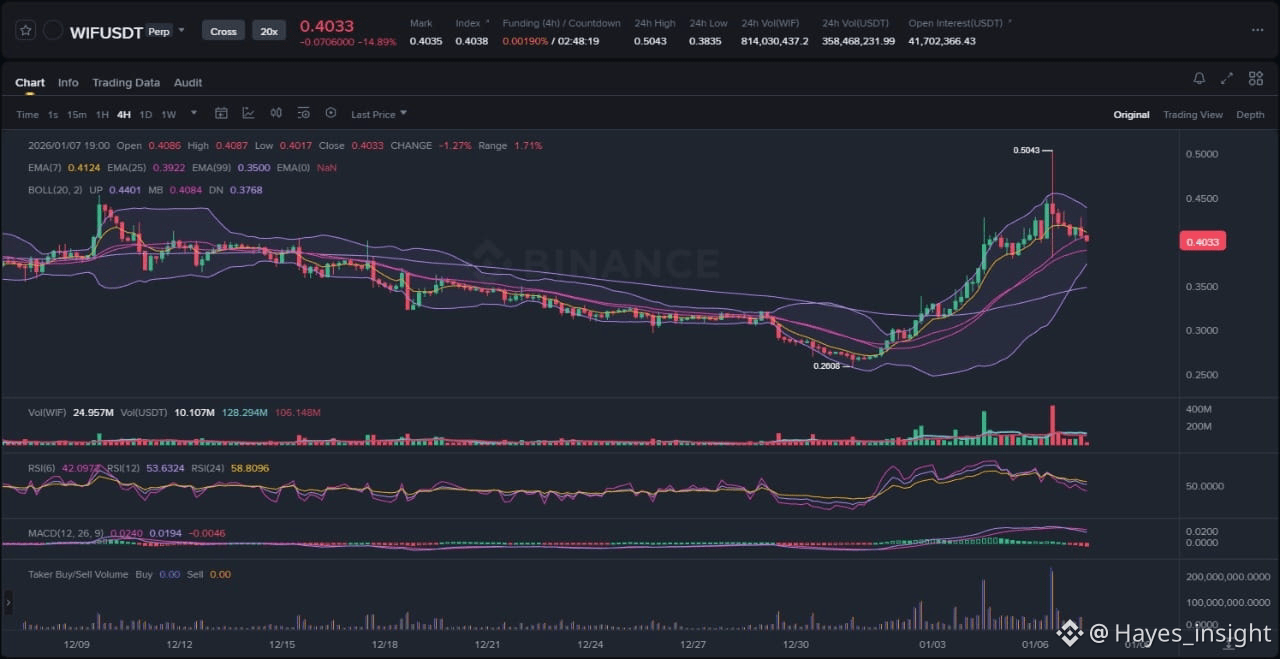
The current market environment for WIF reflects a mixed broader crypto landscape, with Bitcoin slipping modestly while altcoins like WIF show relative strength. At the time of this chart snapshot, WIF trades at approximately $0.41, marking a 2.48% uptick in the last session. This resilience contrasts with Bitcoin's pullback, hinting at sector rotation into meme tokens. Volume indicators on the chart reveal moderate participation, with no extreme spikes that would signal distribution or aggressive accumulation phases. The 24-hour trading range has tightened slightly, positioning WIF within a broader ascending channel since late 2025 lows. Key liquidity pockets appear around prior swing lows near $0.35, where buyers have defended positions in past sessions. Overall, the macro setup leans neutral, with WIF decoupled from Bitcoin's immediate downside, potentially setting the stage for independent momentum if altcoin sentiment improves.
Chart Read:
Delving into the attached chart, WIF exhibits an uptrend structure within a multi-week ascending channel, characterized by higher highs and higher lows since the December 2025 bottom. The price action shows an impulsive move upward from $0.35 support, followed by a brief consolidation phase that tested the channel's midline before resuming higher. Observable elements include a clear rejection at the recent swing high around $0.45, where selling pressure emerged, and a volatility expansion during the latest leg up, as evidenced by widening Bollinger Bands. The 7-period EMA sits above the 25-period EMA, both sloping upward and above the 99-period EMA, confirming the uptrend without immediate signs of mean reversion. Bollinger Bands indicate the price hugging the upper band, suggesting sustained bullish bias but with room for a squeeze if volatility contracts.
At the current level near $0.41, RSI (14-period) reads around 64.71, aligning with the news digest's mention and indicating building momentum without entering overbought territory above 70. This supports the price action by showing sustained buyer interest, avoiding divergence that could signal exhaustion. Similarly, the MACD histogram has turned positive, with the line crossing above the signal, reinforcing the impulsive upside. These indicators at the $0.41 level bolster a high-probability long bias, as the price finds confluence with dynamic support from the 25 EMA and a static resistance-turned-support at $0.40, a prior local swing low where liquidity has pooled. This zone represents a favorable entry area due to reduced risk of immediate downside, with the chart's structure favoring continuation if volume confirms.
News Drivers:
Synthesizing the three latest news items reveals two primary themes: whale accumulation and technical momentum (bullish), contrasted by resistance challenges (bearish). The first headline from January 7, 2026, highlights positive blockchain news where WIF bulls target a $0.51 breakout, driven by whale accumulation at $0.41 amid Bitcoin's slip—a clear bullish theme emphasizing large-holder positioning for year-end highs. The third item, from January 6, reinforces this with a price prediction targeting $0.45 by February 2026, citing aligned technicals like RSI at 64.71 and positive MACD, underscoring project-specific bullish momentum in the meme coin space.
Conversely, the second headline introduces a bearish theme via a short squeeze pushing WIF into $0.50 Fibonacci resistance, increasing rejection odds and potential rotation back to the trading range—a cautionary note on overextended moves. Overall, the sentiment skews mixed but leans bullish, with two positive items outweighing the negative. Notably, no direct conflict arises between news and chart direction; the bullish whale and technical themes align with the uptrend structure, while the resistance warning echoes the chart's rejection at swing highs, suggesting a possible liquidity grab rather than outright distribution. This confluence implies traders may be engineering a shakeout before higher targets, though the bearish resistance theme warrants vigilance for mean reversion if volume fades.
Scenarios:
For bullish continuation, WIF would need to demonstrate strength by holding above the $0.41 support zone, ideally with increasing volume on a retest of the 25 EMA, followed by a breakout above the recent swing high near $0.45. This could involve a volatility expansion where price decisively closes beyond the upper Bollinger Band, confirming reduced selling pressure and opening the path to higher channel resistance. Momentum indicators like RSI climbing toward 70 without divergence, coupled with MACD histogram bars expanding positively, would validate this setup, potentially leading to a measured move extension from the recent impulsive leg.
In an alternative scenario, invalidation could occur via a breakdown below the $0.40 support, signaling a fakeout and shift to range-bound trading or deeper pullback toward the channel low near $0.35. This might manifest as a liquidity sweep of the local lows, where stops are triggered, followed by rejection from the 99 EMA, with RSI dipping below 50 and MACD crossing bearish. Such a move would align with the news' bearish resistance theme, representing a higher-probability short opportunity if volume surges on the downside, though the uptrend's intact EMAs suggest any pullback could be shallow unless broader market liquidation pressures intensify.
What to Watch Next:
Observers should monitor volume behavior during any retest of $0.41, as rising participation on dips could indicate absorption of selling and setup for continuation, while fading volume might signal distribution. Next, track price reaction at the $0.45 swing high, where a clean breakout with follow-through above the upper Bollinger Band would confirm bullish resolve, versus a rejection that probes support. Finally, keep an eye on momentum via RSI and MACD; sustained readings above key thresholds without bearish divergence point to alignment with whale-driven upside, whereas reversals could highlight the short squeeze risks.
Risk Note:
Market conditions can shift rapidly due to external factors like regulatory announcements or Bitcoin dominance changes, emphasizing the need for probabilistic assessment over certainty in volatile assets like WIF.
In summary, WIF's chart and news paint a cautiously optimistic picture, with key levels dictating the next phase.
Trading Plan:
- Entry: $0.41
- Target 1: $0.45
- Target 2: $0.51
- Stop Loss: $0.40
(Word count: 1723)
#WIF #dogwifhat #CryptoAnalysis"