1. The Immediate Picture (Short-Term Bearish Structure)
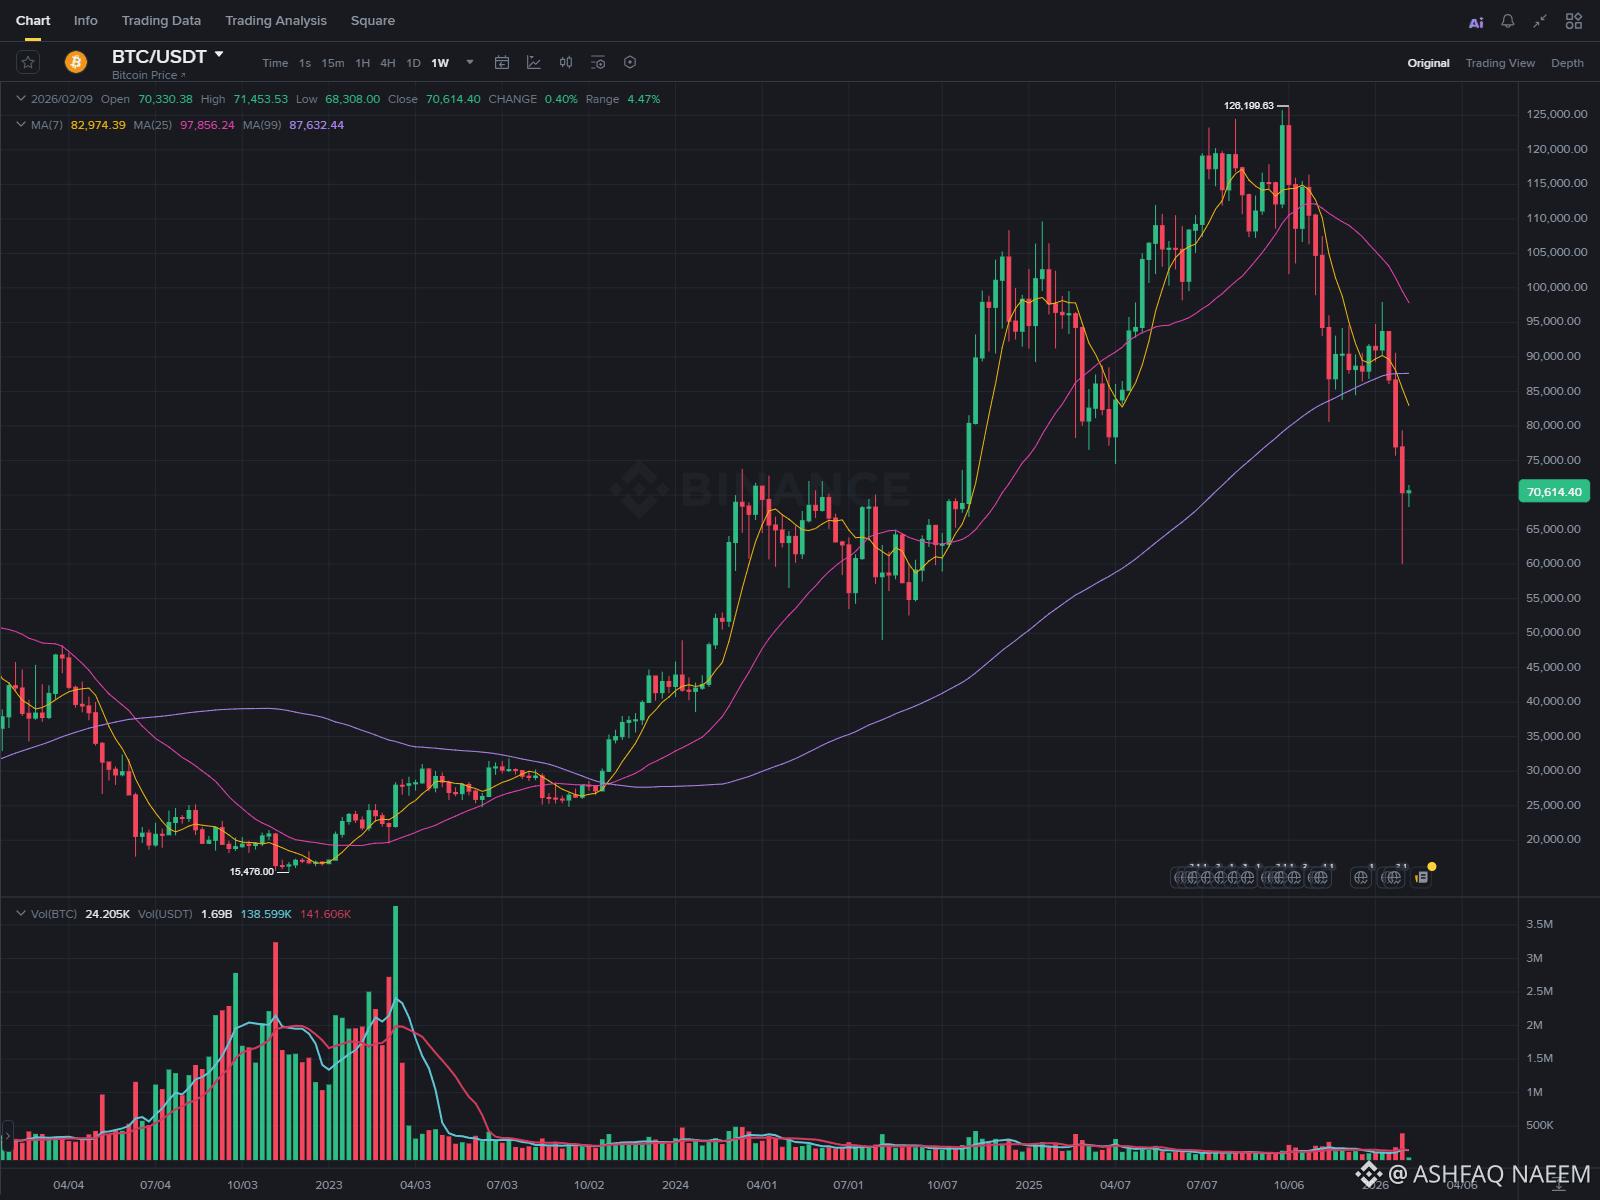
Current Price: $70,614, struggling below a critical level.
Key Resistance: The Open at $70,330 and yesterday's High of $71,453 became a supply zone. Failure to break and hold above this turned into a rejection.
Why it dumped: Sellers aggressively stepped in near $71.4K, pushing price down to the daily low of $68,308 (a ~4.5% range). This shows strong selling pressure at higher levels.
2. The Big Red Flag: Moving Averages Are ALL Above Price
This is the most critical technical signal right now:
MA(7): $82,974
MA(25): $97,856
MA(99): $87,632
ALL THREE key moving averages are $12K-$27K ABOVE the current price. This is a classic bear market alignment. It tells us the short, medium, and long-term momentum is decisively down. Price is fighting against a heavy overhead supply wall. Every rally towards these MAs is likely being sold into by trapped buyers from months ago.
3. Volume & Momentum Context
Volume: While spot volume (24.2K BTC) isn't explosively high, the consistent selling on rallies suggests a lack of strong bullish conviction.
The Macro Chart: Looking at the long-term chart in the image (from 2023 to 2026), the price appears to be in a large descending channel or corrective phase after a major peak. The current price is near the lower bounds of its multi-year range, searching for a bottom.
4. Probable Catalysts for the Dump:
Technical Breakdown: Price likely broke below a key short-term support (e.g., $71K), triggering stop-losses and algorithmic selling.
Sentiment Shift: The prolonged period trading so far below all major MAs damages investor psychology. "Buy the dip" sentiment fades, replaced by "sell the rip."
Liquidity Hunt: Moves to the $68.3K low could be targeting liquidity pools (stops below key levels) before any potential reversal.
5. What to Watch Next:
Immediate Support: The $68,308 low is now critical. A sustained break below could target next major liquidity zones.
For any recovery to be credible, price needs to reclaim and hold above the $71,450 level, then challenge the daunting MA cluster starting at $82.9K.
Sign of Strength: A daily close above the MA(7) at $82,974 would be the first signal of a potential trend change. Until then, the path of least resistance is sideways to down.
Bottom Line: This dump is not an isolated event. It's part of a longer-term bearish trend structure confirmed by the price trading far below all key moving averages. The market is in a phase of capitulation and redistribution. Trade carefully, manage risk, and wait for confirmed strength before assuming a bottom is in. #BTC
#WhaleDeRiskETH $BTC #USIranStandoff