 The crypto world is buzzing today as bold predictions of a "Parabolic Breakout" collide with a volatile market reality. While enthusiasts point to charts suggesting a climb to $150,000+, the current price action tells a more complex story of institutional pressure and historical support.
📉 The $70,000 Line in the Sand
Social media is currently alight with the definitive claim: "Bitcoin will now never trade below $70,000." However, looking at the tape today, February 11, 2026, Bitcoin is engaged in a fierce tug-of-war right at that psychological level. Just yesterday, the price was hovering around $69,185, having recently bounced back from a "flash crash" toward $60,000 last week.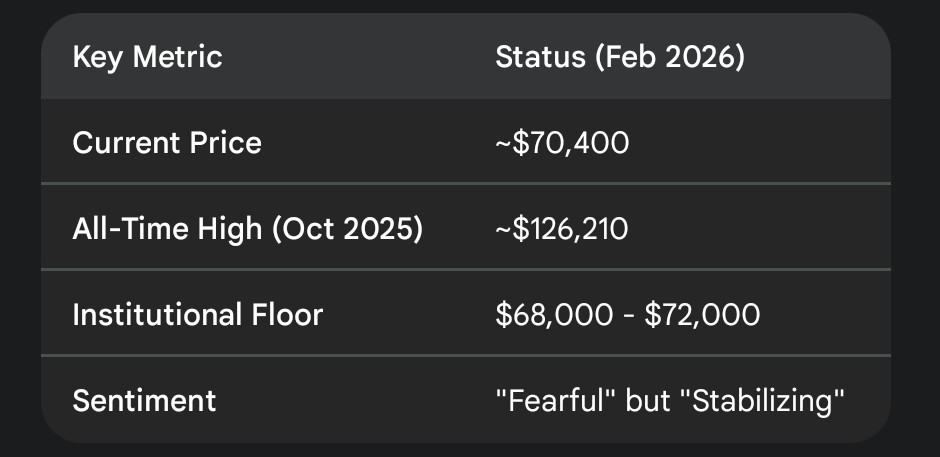
🚀 The Case for the "Biggest Bull Run"
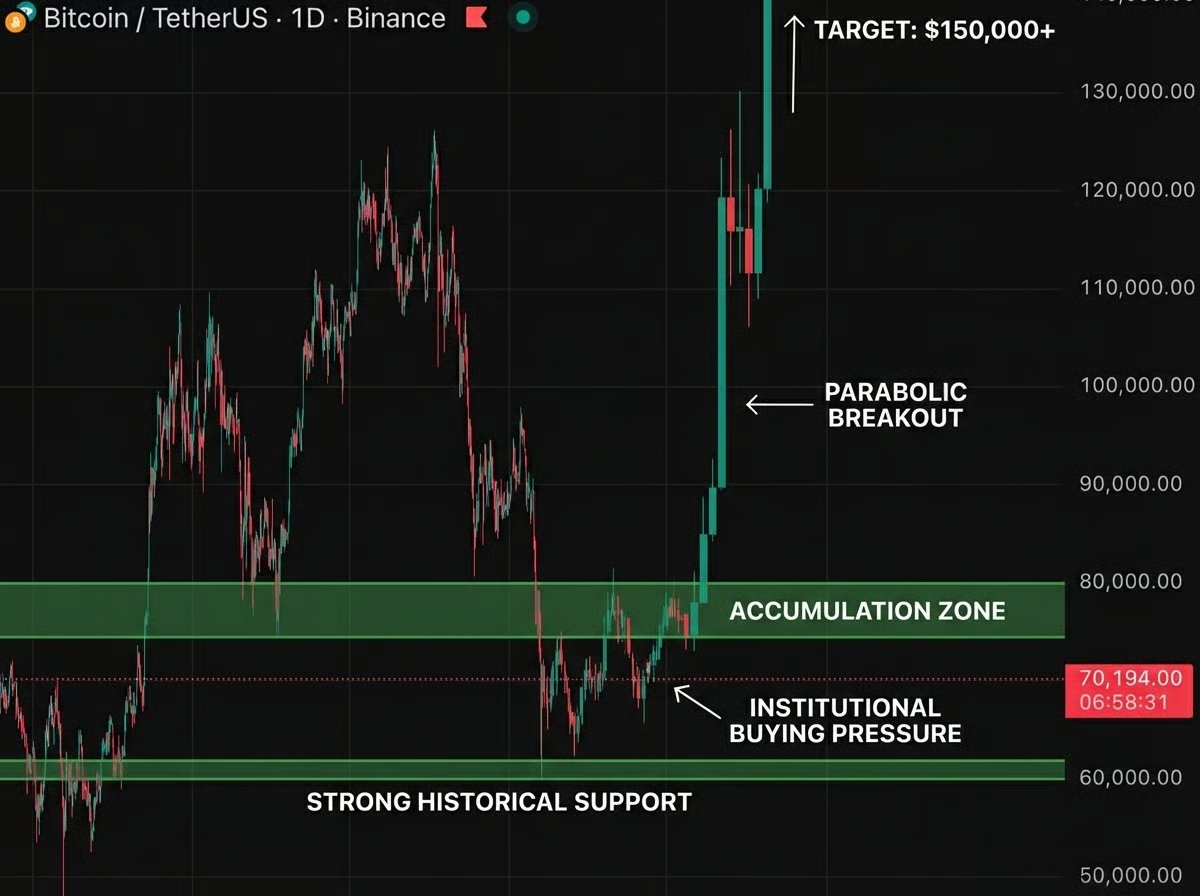
Proponents of the parabolic move, as seen in the viral chart above, highlight several key technical indicators:
The Accumulation Zone: A massive block of buying between $75k and $80k suggests that "smart money" is positioning for a leg up.
Institutional Buying Pressure: Despite the recent 45% drawdown from the 2025 peak, the "Institutional Buying Pressure" zone around $70k has historically triggered sharp rebounds.
The Target: With a breakout above the previous consolidation, analysts are eyeing $150,000 as the next logical milestone in this cycle.
"Bitcoin has matured into a macro-sensitive heavyweight. While the dip to $60k was painful, it cleared out the leverage needed for the next sustainable move higher." — Market Analyst, Feb 2026
⚠️ A Gentle Reality Check
While the energy is high, it’s worth noting that Bitcoin did slip below $70,000 several times in the first week of February 2026. The claim that it will "never" trade below that level again is a bold one—and in the world of crypto, "never" often lasts until the next liquidity crunch.