🔴 Analisis $BTC + Langkah Selanjutnya
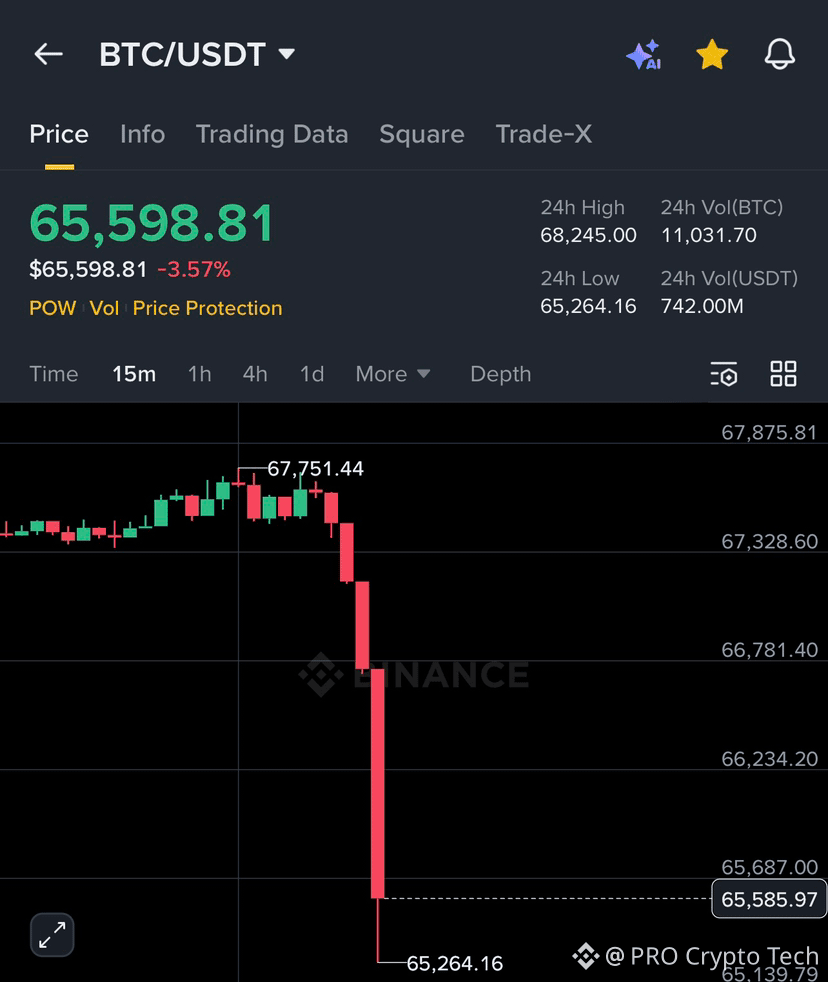
$BTC saat ini menunjukkan kelemahan struktural yang signifikan, diperdagangkan pada $65,598.81 per 23 Februari 2026. Pasar telah memasuki "pergeseran rezim bearish" dengan keyakinan tinggi setelah penolakan besar dari level $68,245.
👉Penurunan vertikal ini menunjukkan kurangnya minat pembeli pada level yang lebih tinggi, mencerminkan pendinginan substansial dari selera institusional saat harga meluncur menuju zona dukungan kritis. 📉⚠️
🔍 Analisis Cepat:
👉Struktur teknis saat ini rapuh. Bitcoin baru saja menembus beberapa dukungan lokal dan kini menguji zona likuiditas utama dekat $65,264, yang bertindak sebagai garis pertahanan terakhir yang segera.
👉 Kontraksi likuiditas yang signifikan—dipicu oleh penjualan institusional—telah menghapus modal besar dari sistem dalam hitungan menit. Sentimen pasar sedang beralih menuju "Ketakutan Ekstrem," dengan grafik 15m menunjukkan volume jual yang berat dan keruntuhan total dari tren bullish sebelumnya. ⛓️🎯
Pembicaraan Nyata: Ini bukan penurunan; ini adalah keruntuhan. Hingga $BTC membalik zona $67,500 kembali menjadi dukungan, jalur resistensi terendah tetap menuju bawah. 🛑🧠
🔱🚀 LANGKAH SELANJUTNYA 🚀🔱
* Jurang Beruang: Penurunan yang berkelanjutan di bawah lantai lokal $65,200 kemungkinan akan memicu flush cepat menuju lantai psikologis $62,000 seiring penjualan panik meningkat. ⛓️🎯
* Perangkap Pemulihan: Bull harus dengan tegas merebut kembali $67,300 untuk menghentikan pendarahan saat ini. Setiap pantulan kecil menuju $66,500 tanpa lonjakan besar dalam volume kemungkinan adalah perangkap bagi pembeli terlambat untuk menyediakan likuiditas keluar. 🌬️⚡
* Garis Bawah: Btc tetap berisiko tinggi. Perhatikan area $65,264 dengan cermat; selama pasar tetap di bawah tekanan jual yang intens ini, beruang mempertahankan kontrol penuh. 🧊💀
Jika Anda ingin grafik koin tertentu dianalisis, komentari nama koin di bawah! 🚀
BTCUSDT
Perp
66,174.6
-2,66%