🚀📌 Quick Reality Check – Timeframe Matters!
Before we dive deep, one important clarification 👇
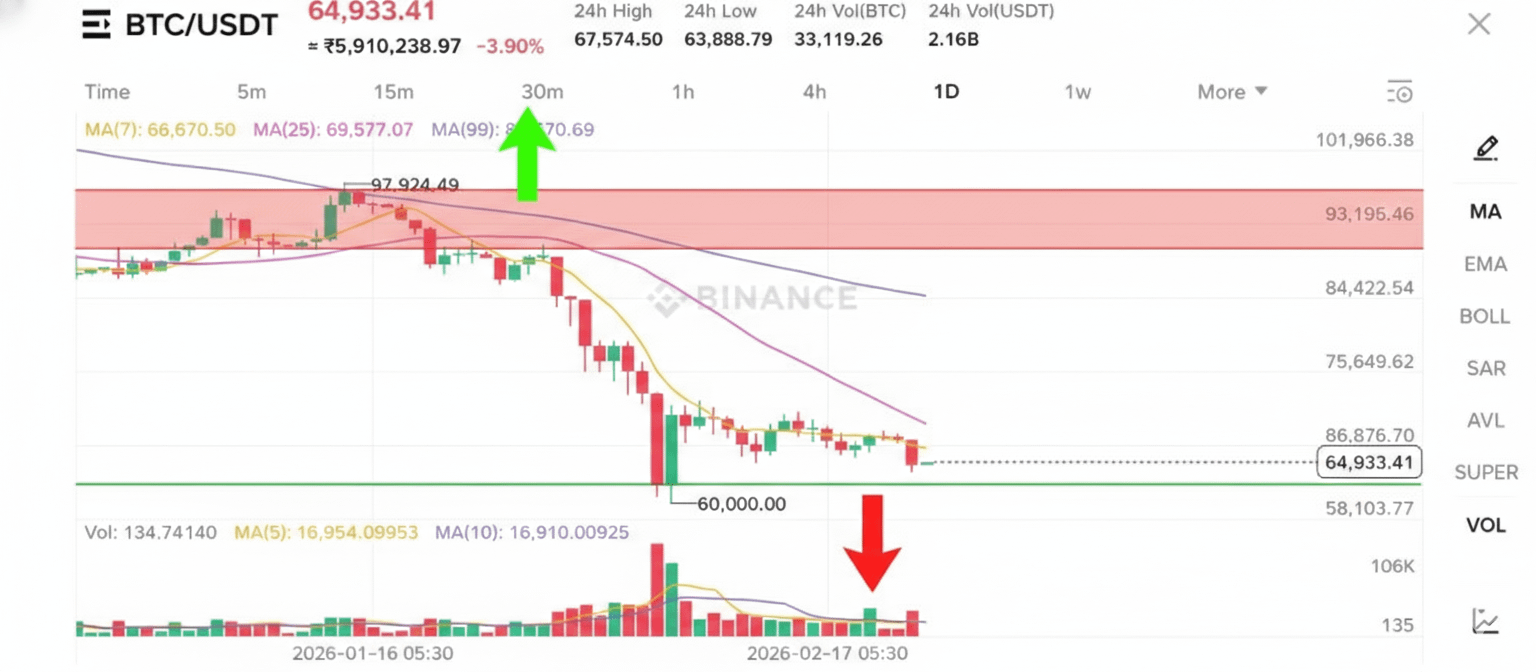
Although 15m timeframe was mentioned, the shared chart is actually set to the 1D (Daily) timeframe ("1D" is highlighted at the top, and dates span from January to February).
✨ And honestly? That’s even better!
Daily timeframe helps us understand the bigger trend, stronger levels, and major market direction.
🧱 1️⃣ Key Support & Resistance Zones
🟢 Major Support – The Strong Floor: $60,000
🔎 What we see:
Price crashed heavily and bounced exactly from this zone.
A clear reaction level.
Strong psychological round number.
💡 Why it matters:
As long as BTC holds above $60K, bulls still have a fighting chance.
⚠️ A clean break below this level changes the entire structure.
🔴 Immediate Resistance – The First Ceiling: $66,670 – $69,577
📍 This zone aligns with:
MA(7) ≈ $66,670
MA(25) ≈ $69,577
Currently, price is struggling below these moving averages.
📉 When price trades under short-term MAs and they slope downward, it signals bearish pressure.
👉 A daily close above this resistance zone would be the first strong bullish sign.
🔥 Macro Resistance – Major High: ~$97,924
This marks the previous local top before the heavy downtrend started.
🚨 Until BTC reclaims higher structure levels, this zone remains long-term resistance.
📊 2️⃣ Trend & Volume Analysis
📉 Current Trend: Bearish
✔ Price is trading below MA7, MA25, and MA99
✔ Moving averages are fanning downward
✔ Lower highs structure still intact
This confirms short-term and mid-term bearish momentum.
📦 Volume Insight – Capitulation Signal?
During the sharp drop toward $60K, we saw a massive spike in volume.
In technical analysis, extreme sell volume often suggests:
Panic selling
Weak hands exiting
Possible short-term or long-term bottom formation
⚡ This is commonly called capitulation.
But remember: Volume alone is not confirmation — price structure must follow.
🎯 3️⃣ Possible Future Scenarios
Markets move in probabilities, not certainties. Here’s what to watch 👇
🚀 Bullish Scenario – The Pump Setup
For a real bullish reversal:
✅ Daily candle close above $69,500
✅ Strong buying volume confirmation
✅ Break above MA25 resistance
If this happens, next potential upside magnet:
🎯 $84K zone (around MA99)
That’s where momentum could accelerate.
💥 Bearish Scenario – Breakdown Risk
If BTC loses $60,000 with strong selling volume:
❌ Major support breaks
❌ Panic selling could return
❌ Fast drop toward next historical supports possible
This would confirm bearish continuation.
🔄 Chop Scenario – Sideways Consolidation
Currently, BTC is moving between:
📦 $60K – $66K range
After a large dump, markets often:
Move sideways
Build liquidity
Trap traders both sides
Prepare for the next big move
⏳ This consolidation phase can last days or even weeks.
🧠 Final Thoughts
Right now, BTC is at a critical decision zone.
🔹 Above $69.5K → Momentum shift possible
🔹 Below $60K → Bearish continuation
🔹 Between them → Expect volatility & fakeouts
Trade smart. Manage risk. Let the daily candles confirm direction. 📊