$ETH Facing a Critical Crossroads: Breakout or Bearish Rejection?
The ETH/USDT 4-hour chart reveals a sophisticated battle between bulls and bears at a major psychological and technical resistance zone. After a period of volatile consolidation, Ethereum is testing the upper limits of its current range, leaving traders on high alert.
Key Technical Observations:
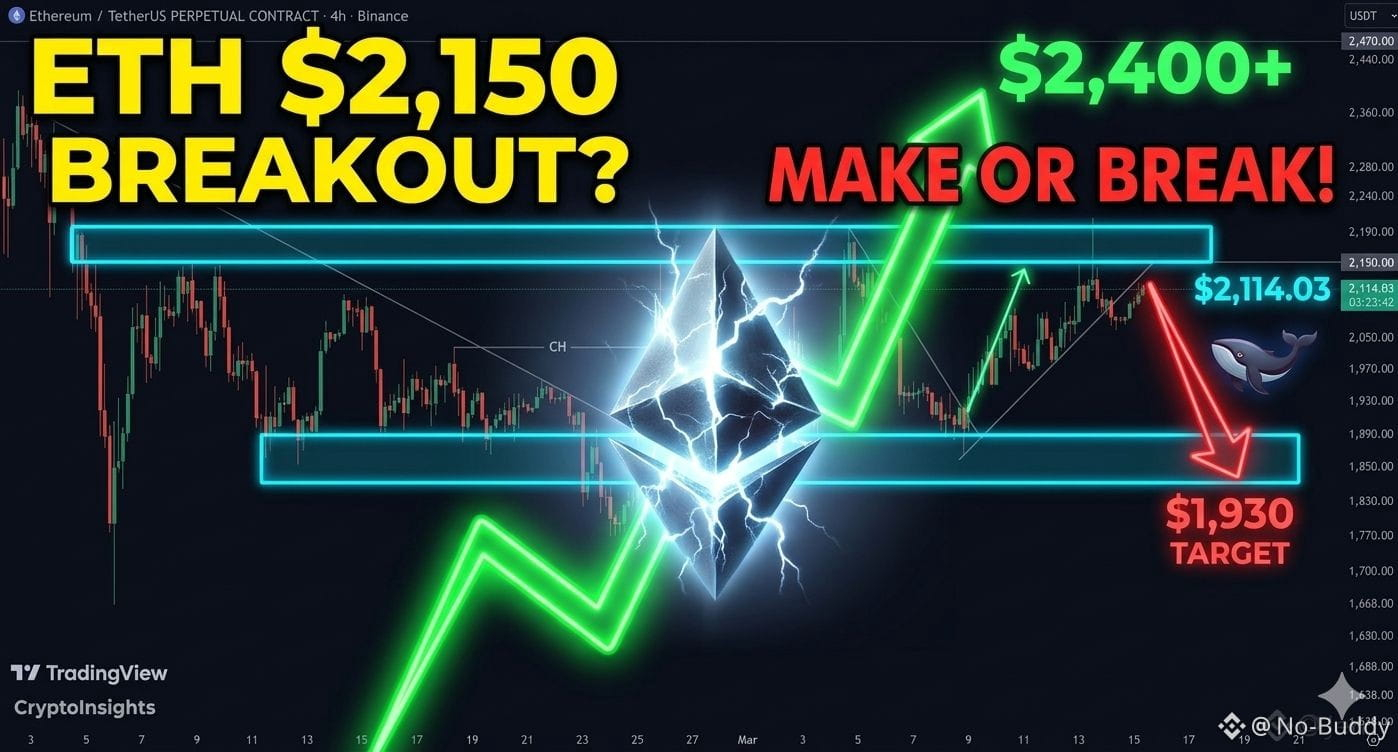
* Major Resistance Zone: Price action is currently stalling near the $2,150 - $2,190 supply zone (highlighted in green). This area has historically acted as a "ceiling," rejecting previous upward attempts.
* Trendline Dynamics: Following a significant "Change of Character" (CH), the price moved out of its descending structure and transitioned into an ascending triangle/wedge formation.
* The Pivot Point: We are seeing a consolidation right under the $2,150 horizontal level. The chart indicates two potential paths:
* Bullish Scenario: A clean breakout and candle close above $2,190 could trigger a surge toward the $2,400+ levels.
* Bearish Scenario (Current Outlook): The red arrow suggests a potential rejection at this resistance, leading to a retracement back toward the $1,930 support zone to gather more liquidity.
Market Strategy:
Patience is key here. Entering at resistance is high risk. Conservative traders should wait for a confirmed breakout or look for buy-side opportunities if the price dips back into the lower demand zone near $1,900.
#Ethereum #CryptoAnalysis #Ethereum #tradingStrategy #altcoins
TRADE NOW
