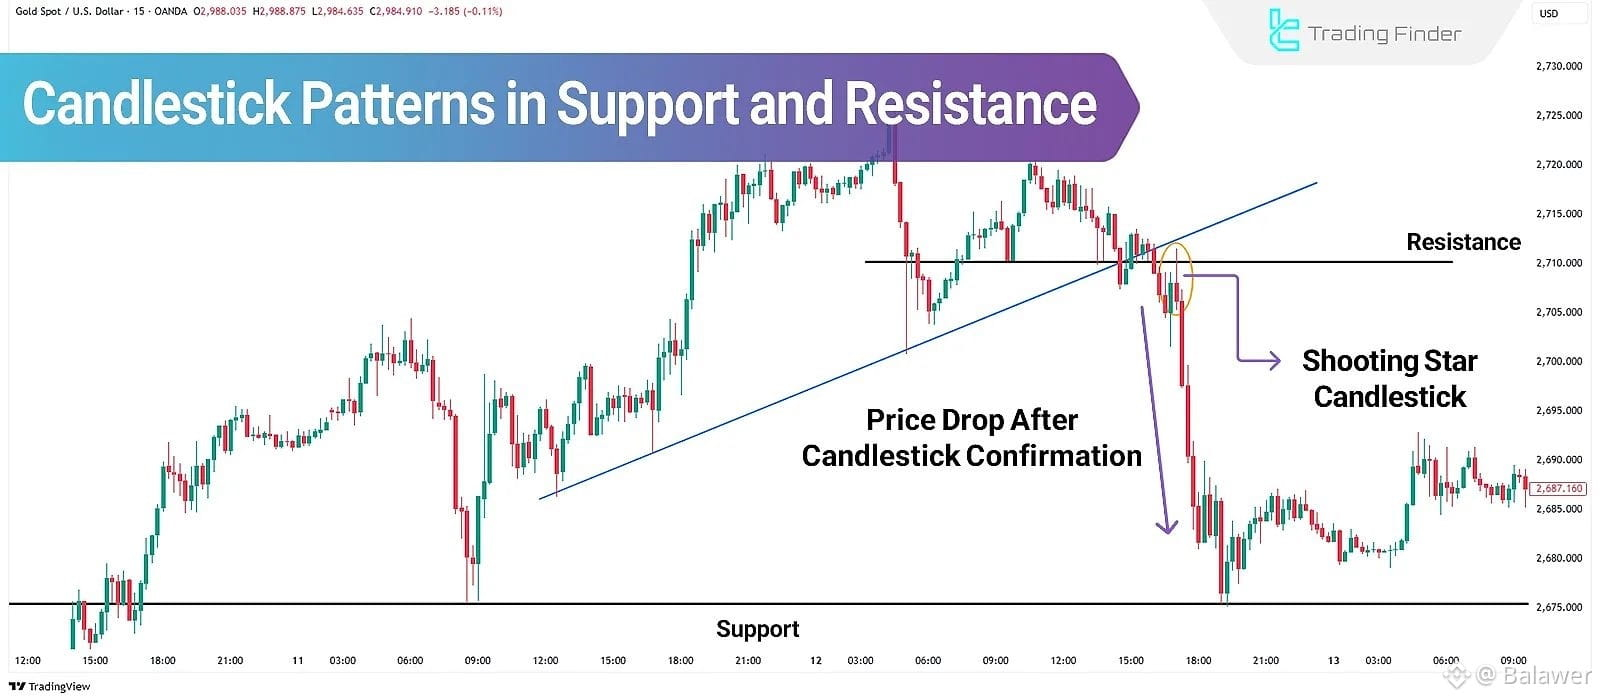
Visual candlestick examples that justify the trading setups I mentioned (support, resistance, and breakout trades). These types of patterns are widely used in crypto trading to find entries and exits. Candlestick charts show open, close, high, and low prices, helping traders understand market momentum. (TradingView)
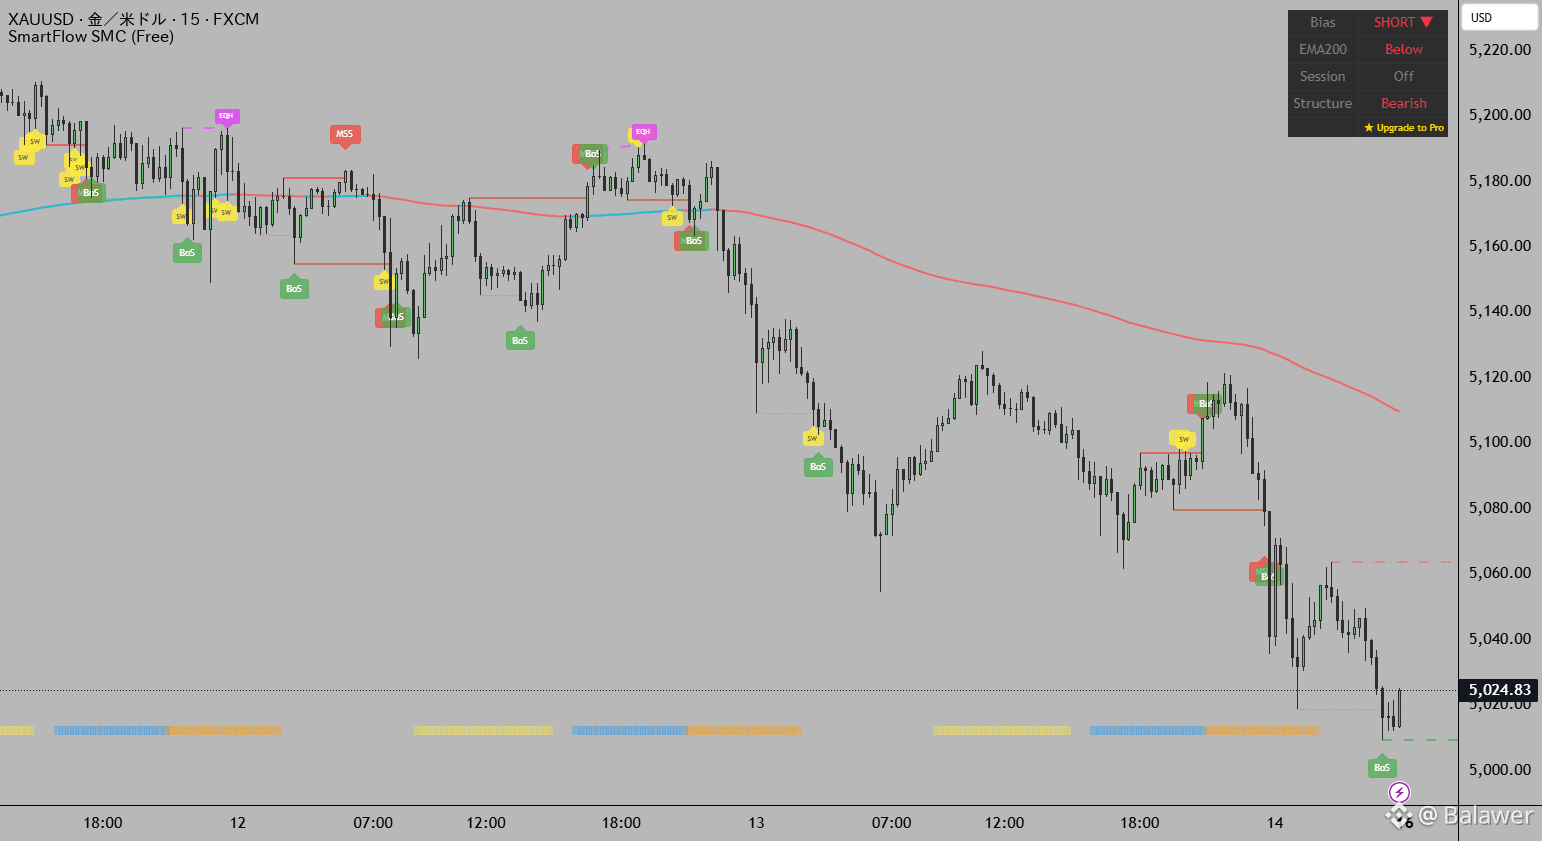
📈 1. Bitcoin Breakout Trade (Resistance Break)
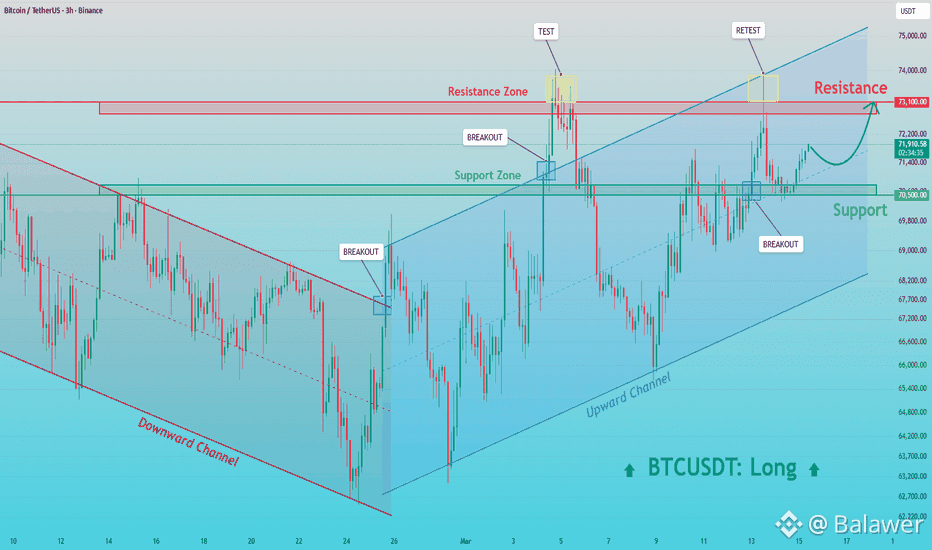
What this shows #BTC
Red line = Resistance zone
Price keeps touching the resistance
Once candles close above resistance, a breakout usually happens
Trading idea
Entry: After candle closes above resistance
Target: Next liquidity zone
Stop loss: Below breakout level
👉 This is why I suggested BTC breakout trades around resistance levels.
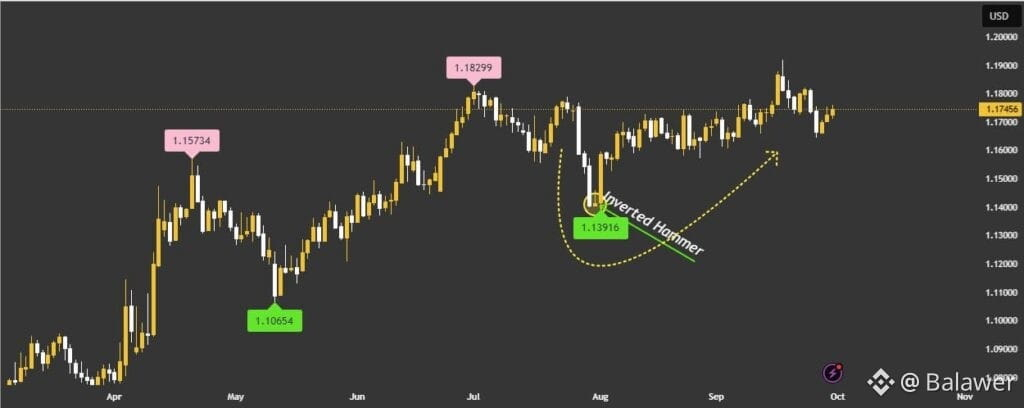
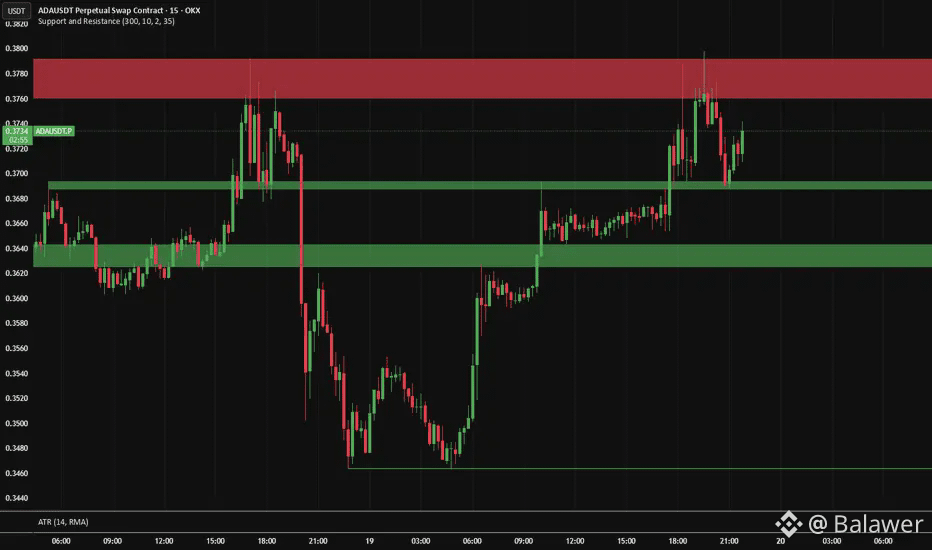
📉 2. Ethereum Dip Buy (Support Bounce)
What this shows #ETH
Green zone = Support
Price repeatedly bounces from support
Bullish candles appear after rejection
Support levels often stop price from falling because buyers step in. (BCMA)
Trading idea
Buy near support
Sell near resistance
👉 This is the logic behind buying ETH dips.
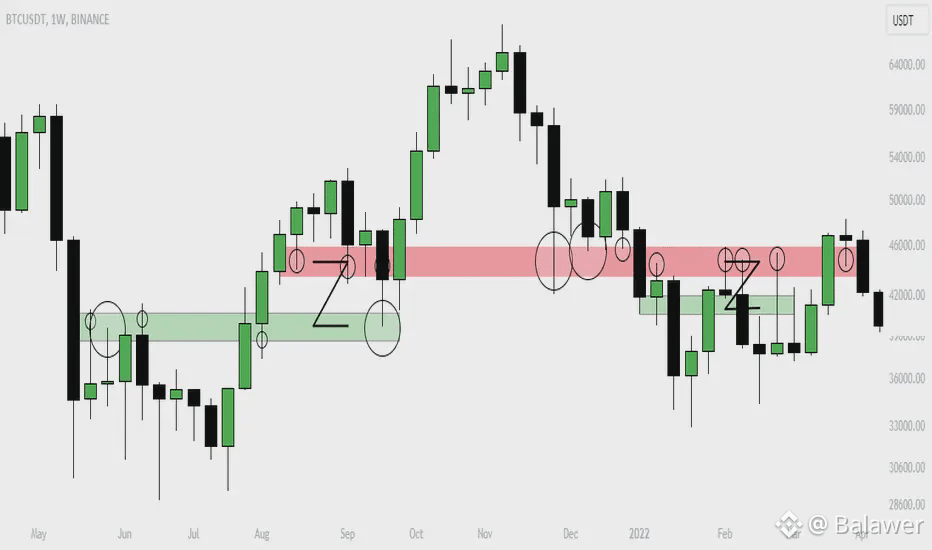
🚀 3. XRP Breakout Momentum Pattern
What this shows #Xrp🔥🔥 XRP
Price consolidates in a range
Liquidity builds
When resistance breaks → fast impulsive move
Trading idea
Entry: breakout candle
Target: 5–15% move
Stop: below range
🧠 Why These Charts Matter
Candlestick patterns help traders understand market psychology and momentum, which is why they are one of the most widely used technical analysis tools. (TradingView)
Traders look for:
Support bounces
Resistance breakouts
Momentum candles
Volume spikes
✅ Best setup today
1️⃣ Breakout: Bitcoin
2️⃣ Dip buy: Ethereum
3️⃣ Momentum: XRP / Solana