$MANTRA is currently facing intense selling pressure following the initial excitement of its Mainnet launch and token swap. Here is a technical breakdown of the current situation and what to expect next.
📉 Technical Analysis (15m & 1D Perspective)
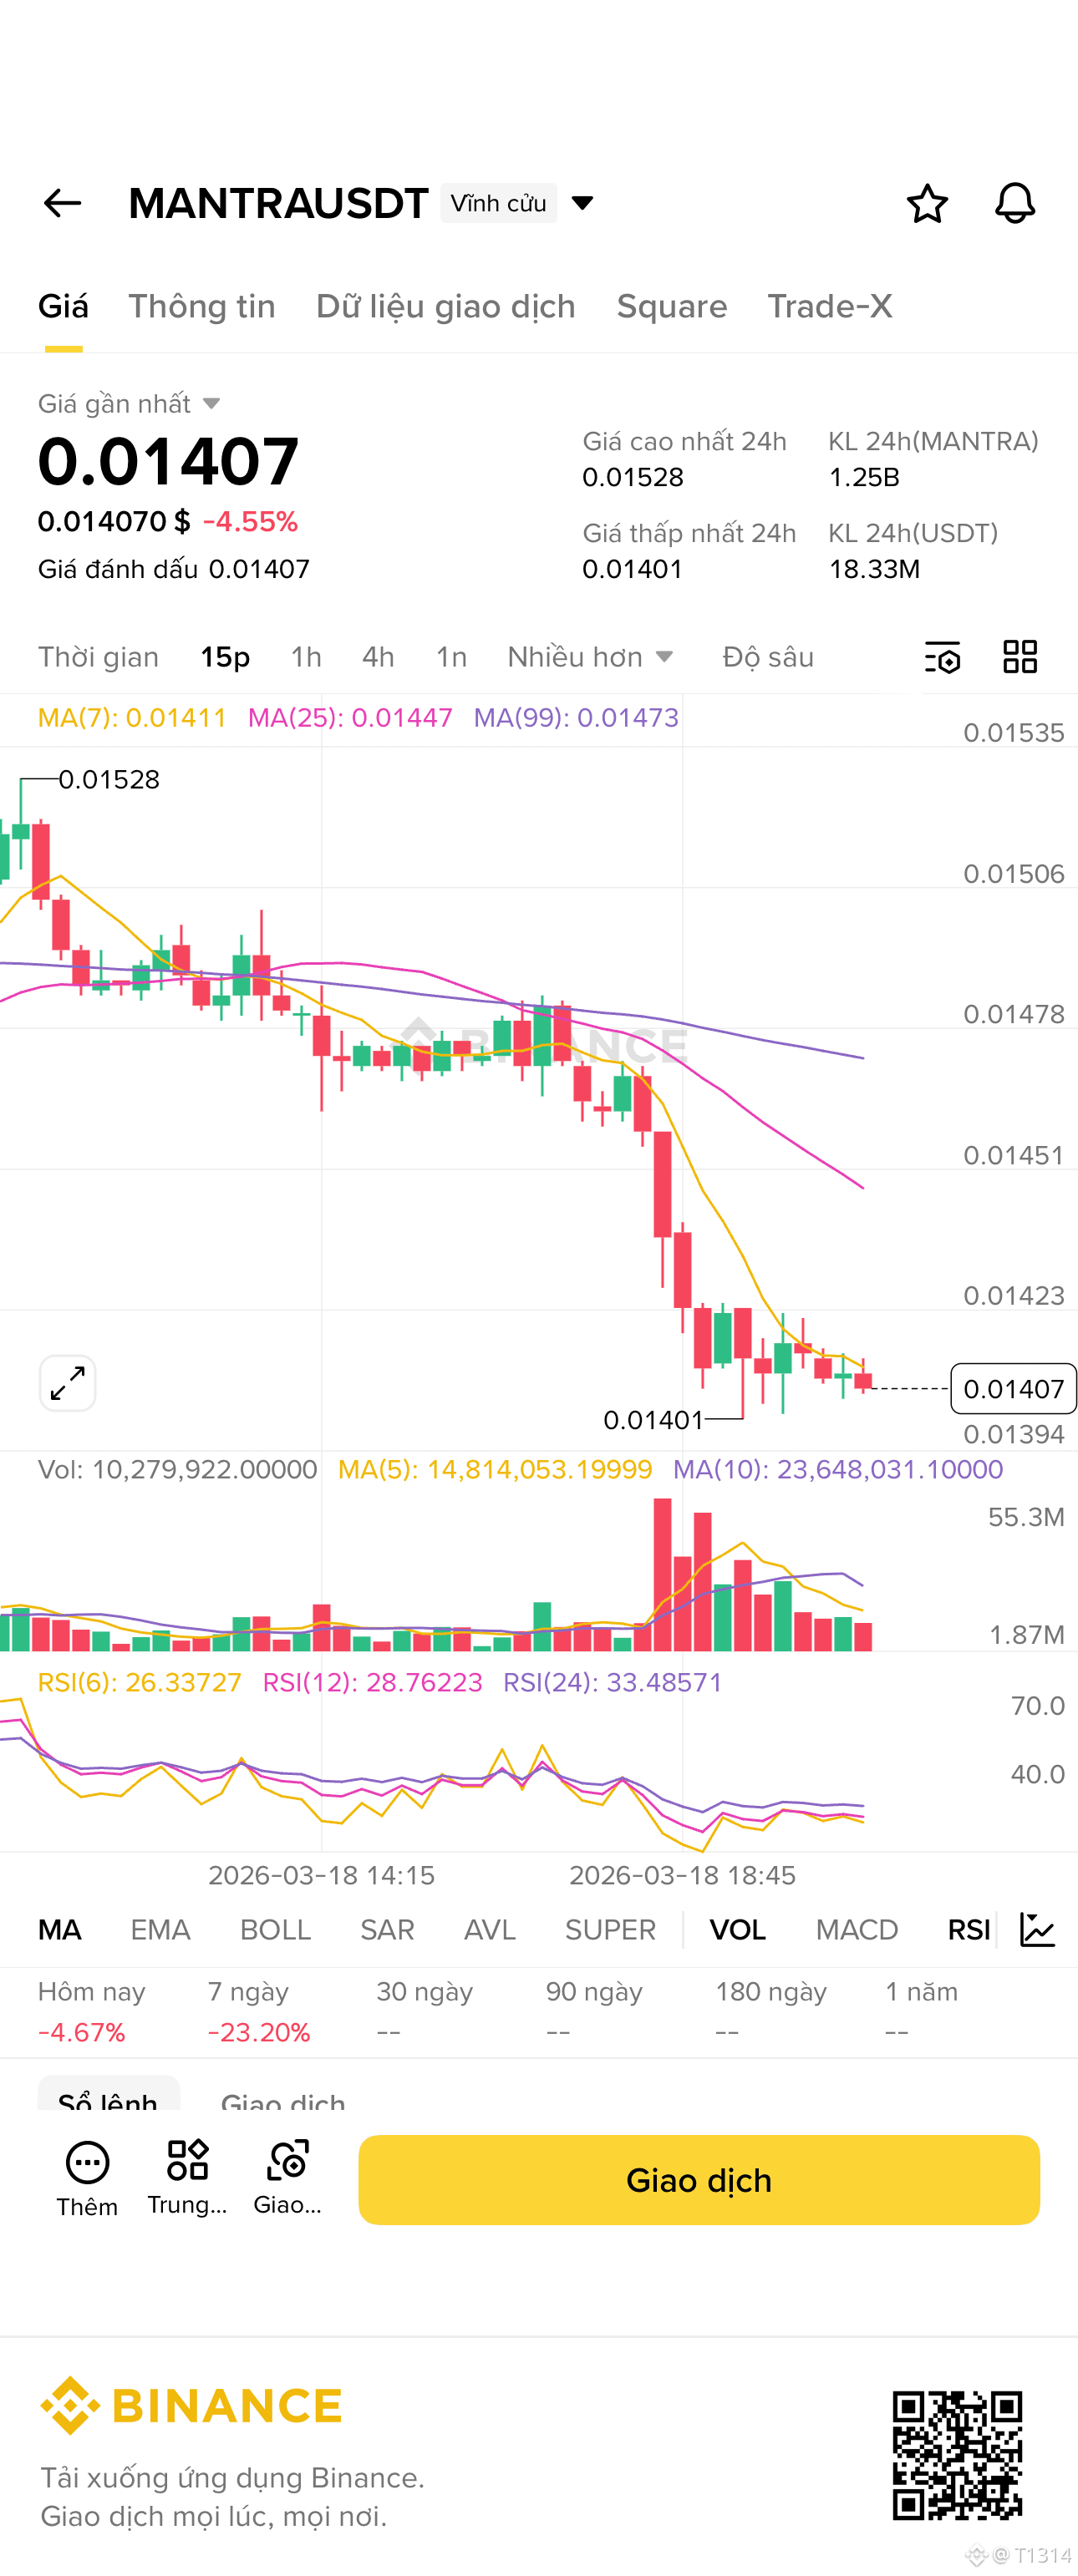
• Current Performance: The price recently hit a 24-hour low of 0.01401 USDT, reflecting a -4.55% decline.
• Trend Confirmation: On the 15m chart, MANTRA is trading significantly below its MA(7), MA(25), and MA(99). This alignment confirms that the short-term bearish trend is firmly in control.
• Oversold Signals: The RSI(6) has plummeted to 26.33. Historically, an RSI below 30 indicates an "oversold" condition, often leading to a temporary technical bounce as sellers exhaust their momentum.
• Critical Levels:
• Major Support: The 0.0138 – 0.0140 zone is the "line in the sand". A daily close below this could trigger further liquidations.
• Immediate Resistance: 0.0152 and the previous consolidation zone at 0.0173.
🔍 Market Sentiment & RWA Narrative
1. Post-Swap Correction: After the 1:4 redenomination, MANTRA saw a massive pump toward 0.026. The current drop to 0.014 is a classic "retest" of historical support levels after the initial hype has settled.
2. Long-Term Fundamentals: Despite the price drop, MANTRA remains a leader in the Real World Asset (RWA) sector. The recent Mainnet v7.0.0 upgrade enhances institutional compatibility, which is a bullish catalyst for long-term holders.
💡 Strategy & Risk Management
• For Long Holders: If you are currently in a position, watch the 0.0138 level closely. It is vital to maintain discipline and avoid revenge trading.
• For New Entries: "Don't catch a falling knife." Wait for a confirmed reversal or for the RSI to cross back above 30 before considering a new entry.
• Leverage Warning: With the current high volatility, ensure your Stop-Loss (SL) is active and keep your leverage manageable (ideally <10x) to survive "wick" liquidations.