Crypto trading mein RSI aur MACD 2 sabse powerful momentum indicators hain. Yeh dono Binance charts (TradingView) par easily add ho jaate hain aur beginners se leke pros tak sab use karte hain.
1. RSI (Relative Strength Index) Kya Hai?
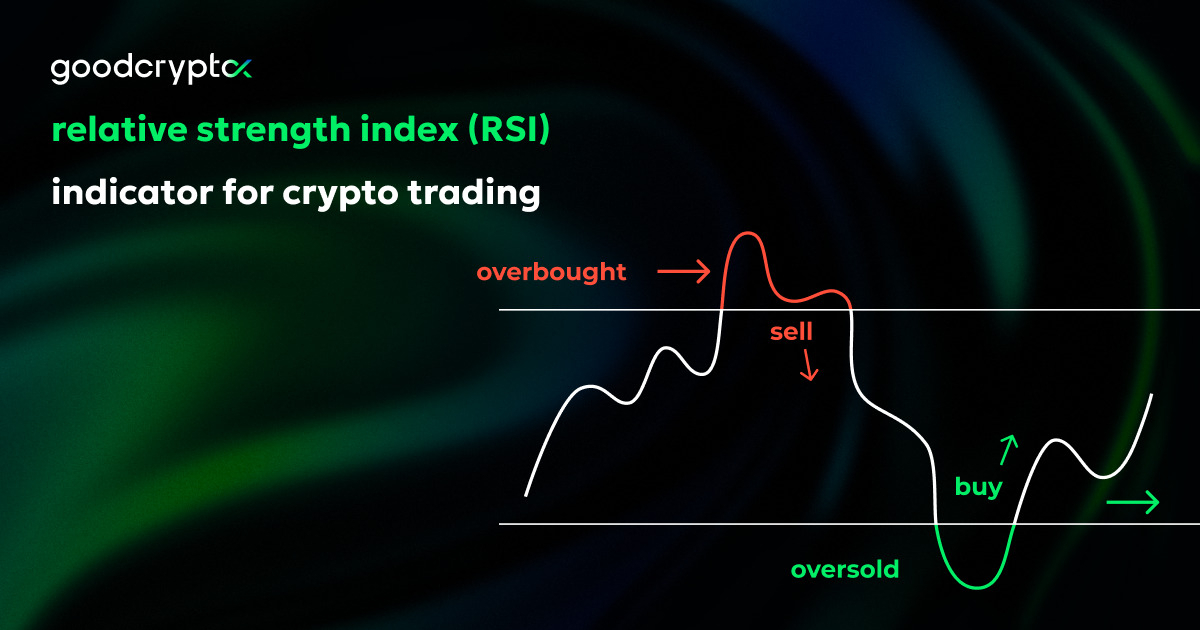
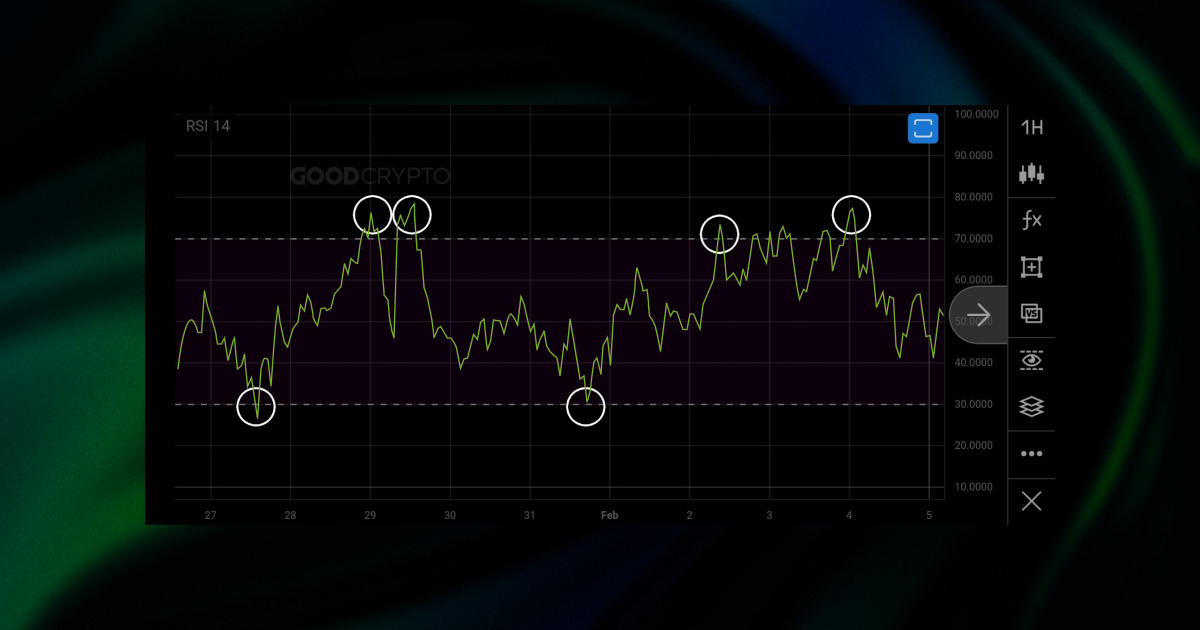
RSI momentum oscillator hai jo price ki speed aur change measure karta hai. Yeh 0 se 100 ke scale par chalta hai (default period 14).
Overbought: RSI > 70 → Price bohot upar chala gaya, correction (down) aa sakti hai → Sell signal.
Oversold: RSI < 30 → Price bohot neeche gira, bounce (up) possible → Buy signal.
Neutral Zone: 40-60 ke beech – strong trend mein useful nahi hota.
Crypto mein volatility zyada hoti hai, isliye kuch traders 80/20 levels use karte hain (instead of 70/30) false signals avoid karne ke liye.
RSI Signals:
RSI 30 se upar cross kare → Bullish (buy potential).
RSI 70 se neeche cross kare → Bearish (sell potential).
Divergence (Powerful Signal):
Bullish Divergence: Price lower lows bana raha hai, lekin RSI higher lows → Reversal upar possible.
Bearish Divergence: Price higher highs, RSI lower highs → Reversal neeche.
2. MACD (Moving Average Convergence Divergence) Kya Hai?
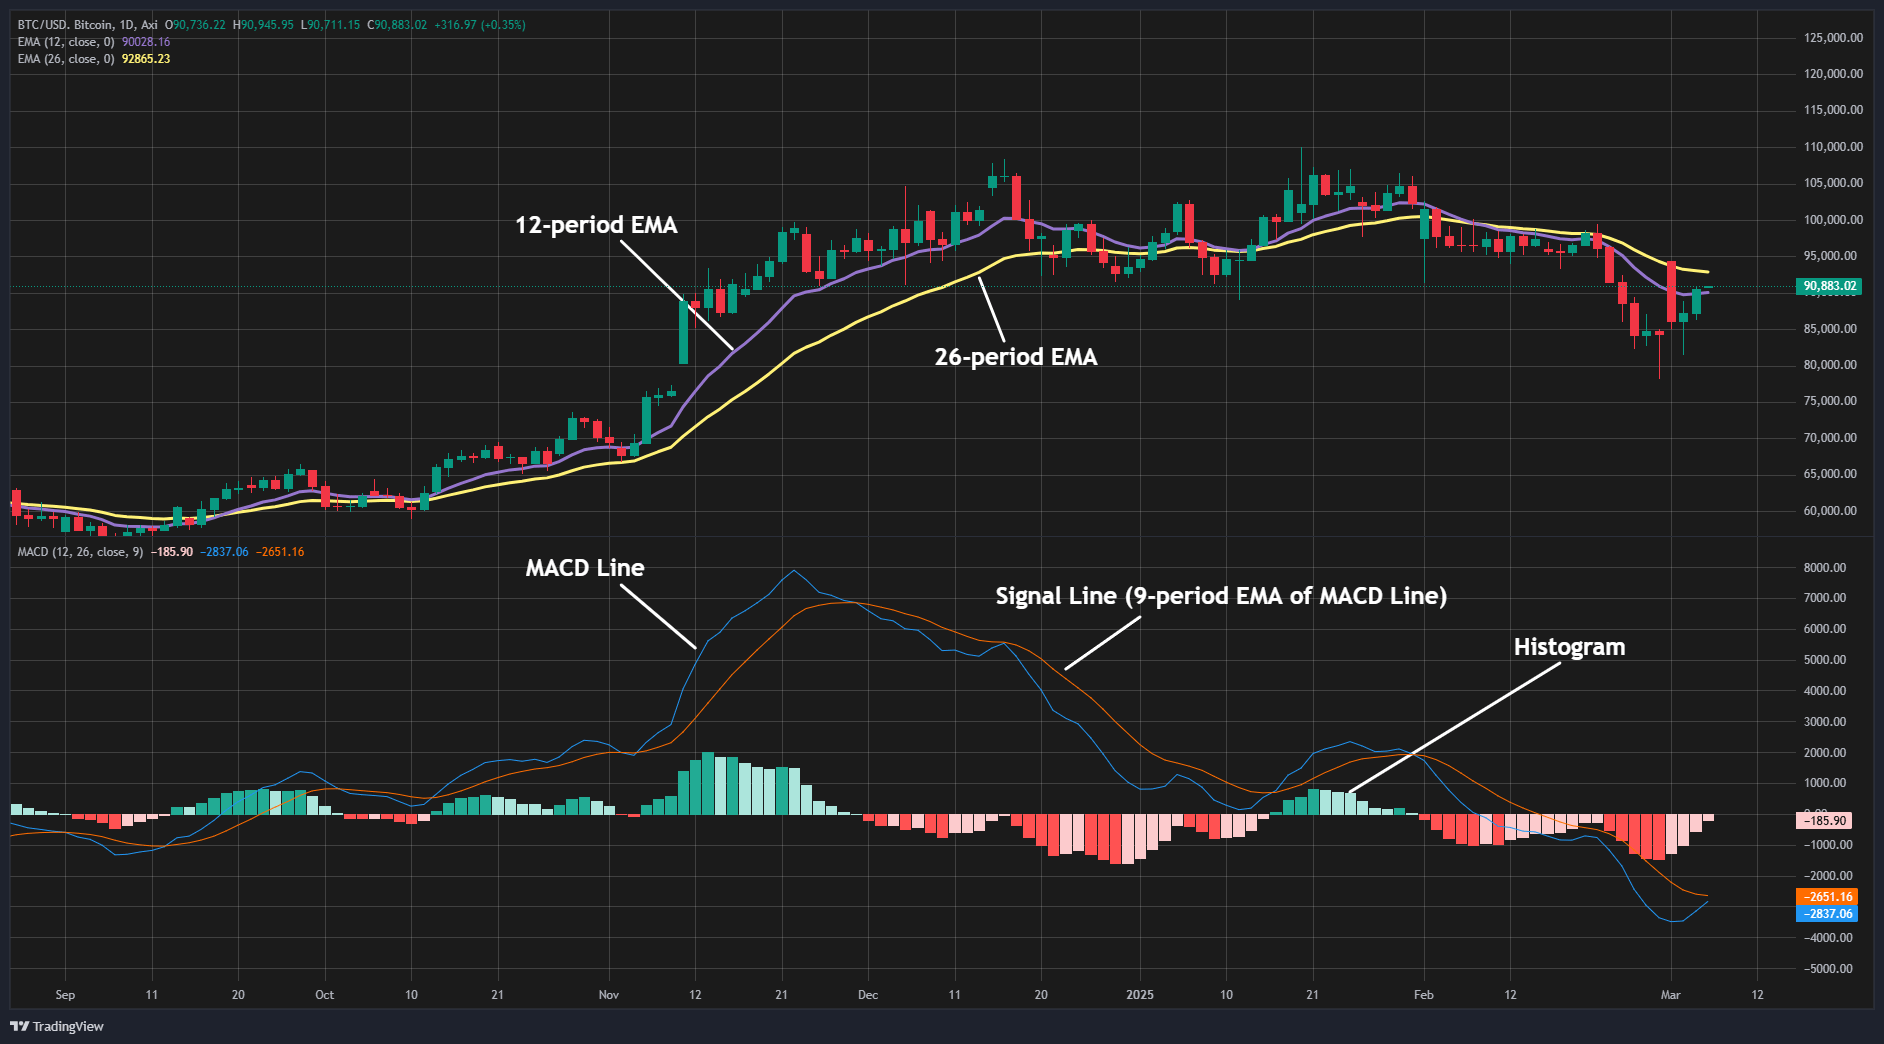
MACD trend-following momentum indicator hai. Yeh do EMAs (Exponential Moving Averages) ke difference se banta hai.
Standard Settings: MACD (12, 26, 9)
MACD Line: 12-period EMA – 26-period EMA (fast line, blue).
Signal Line: MACD Line ka 9-period EMA (orange/red).
Histogram: MACD Line aur Signal Line ke beech ka difference (bars green/red).
Key Signals:
Bullish Crossover (Golden Cross): MACD Line Signal Line ke upar cross kare → Buy signal (momentum up).
Bearish Crossover (Death Cross): MACD Line Signal Line ke neeche cross kare → Sell signal.
Histogram: Bars upar ja rahe hain → Momentum strong bullish. Neeche → Bearish. Zero line cross = trend change.
Divergence in MACD:
Bullish: Price lower lows, MACD higher lows → Strong buy.
Bearish: Price higher highs, MACD lower highs → Strong sell.
Crypto mein MACD fast moves catch karta hai, lekin ranging market mein whipsaws (false signals) de sakta hai.
3. RSI + MACD Ko Combine Kaise Karein? (Best Strategy)
Sirf ek indicator par depend mat karo – dono saath use karne se accuracy badhti hai. Yeh simple combo strategy hai jo bohot traders follow karte hain:
Buy Signal (Long Entry):
RSI oversold zone mein ho (<30 ya <40) ya wahan se upar cross kare (momentum shift).
MACD bullish crossover dikhaaye (MACD Line > Signal Line).
Histogram positive side par shift ho (green bars badhein).
Sell Signal (Short/Exit):
RSI overbought zone mein ho (>70 ya >60) ya wahan se neeche cross kare.
MACD bearish crossover (MACD Line < Signal Line).
Histogram negative side par (red bars).
Extra Confirmation:
Volume spike ho to signal strong.
Price support/resistance break kare.
Higher timeframe (daily) par trend check karo.
Example: Agar BTC RSI 28 par hai (oversold) aur MACD golden cross karta hai → High probability buy. Agar RSI 75+ aur MACD death cross → Sell.
Pro Tip: Crypto mein 1H/4H timeframe par yeh combo best kaam karta hai. Daily par long-term trends ke liye.
How to use RSI and MACD In trading? for COINBASE:BTCUSD by CobraVanguard — TradingView
4. Binance Par Kaise Add Karein
Binance app/web → Trade → Chart → Indicators → Search "RSI" aur "MACD".
Default settings use karo pehle, phir experiment (jaise RSI 7 for faster signals).
Backtest karo paper trading mein.
Risk management: Stop-loss lagao (recent low/high ke neeche), 1-2% risk per trade.
Yeh dono indicators combine karne se aap better entries/exits le sakte ho.
#USFebruaryPPISurgedSurprisingly #SECClarifiesCryptoClassification $BTC $ETH $BNB