📊 ETH Short-Term Analysis (Candlestick View)
Trend:
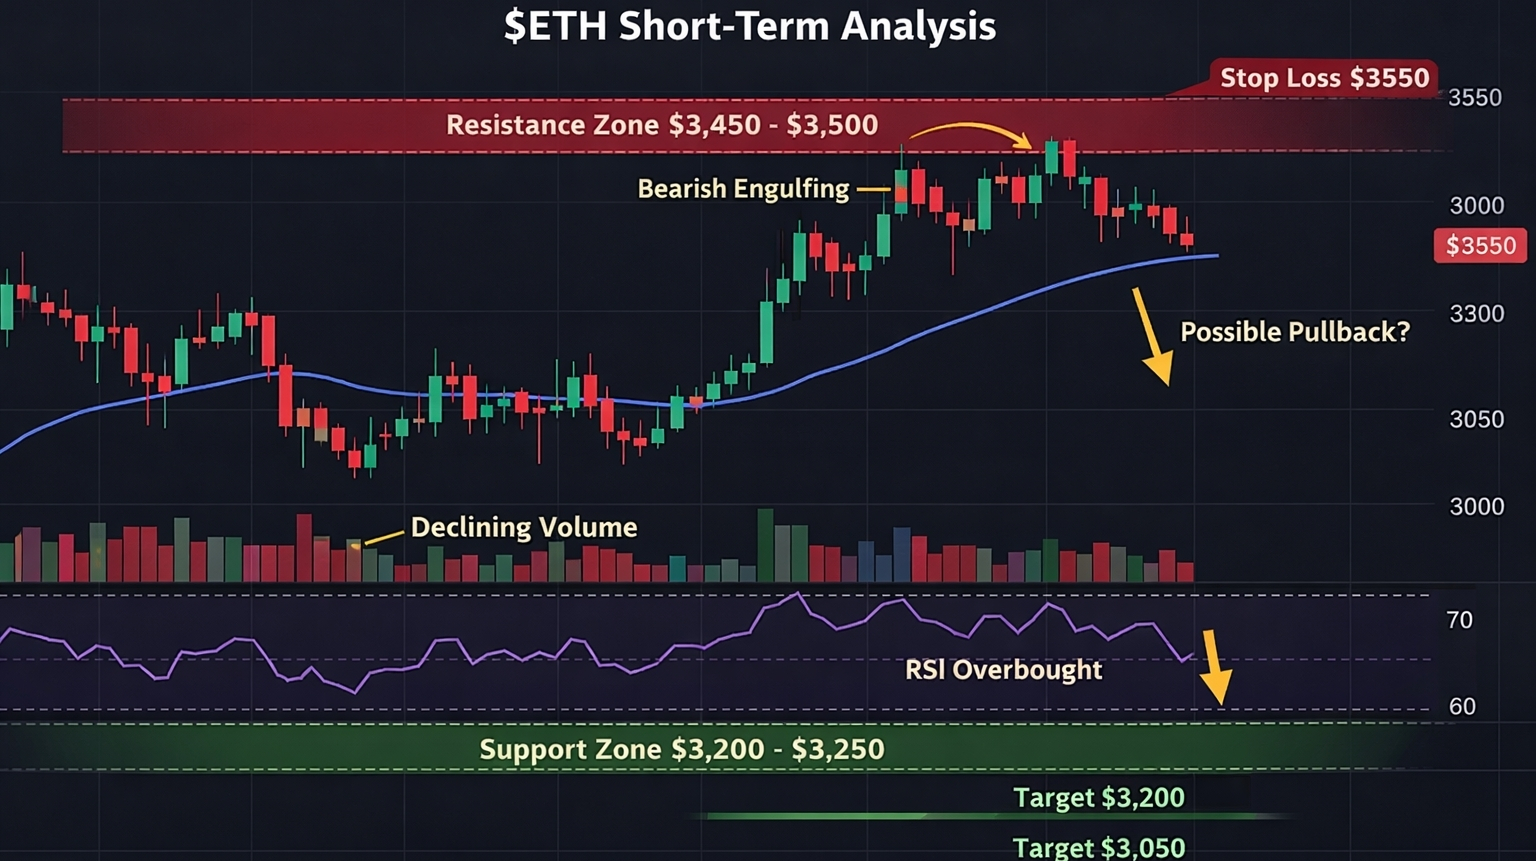
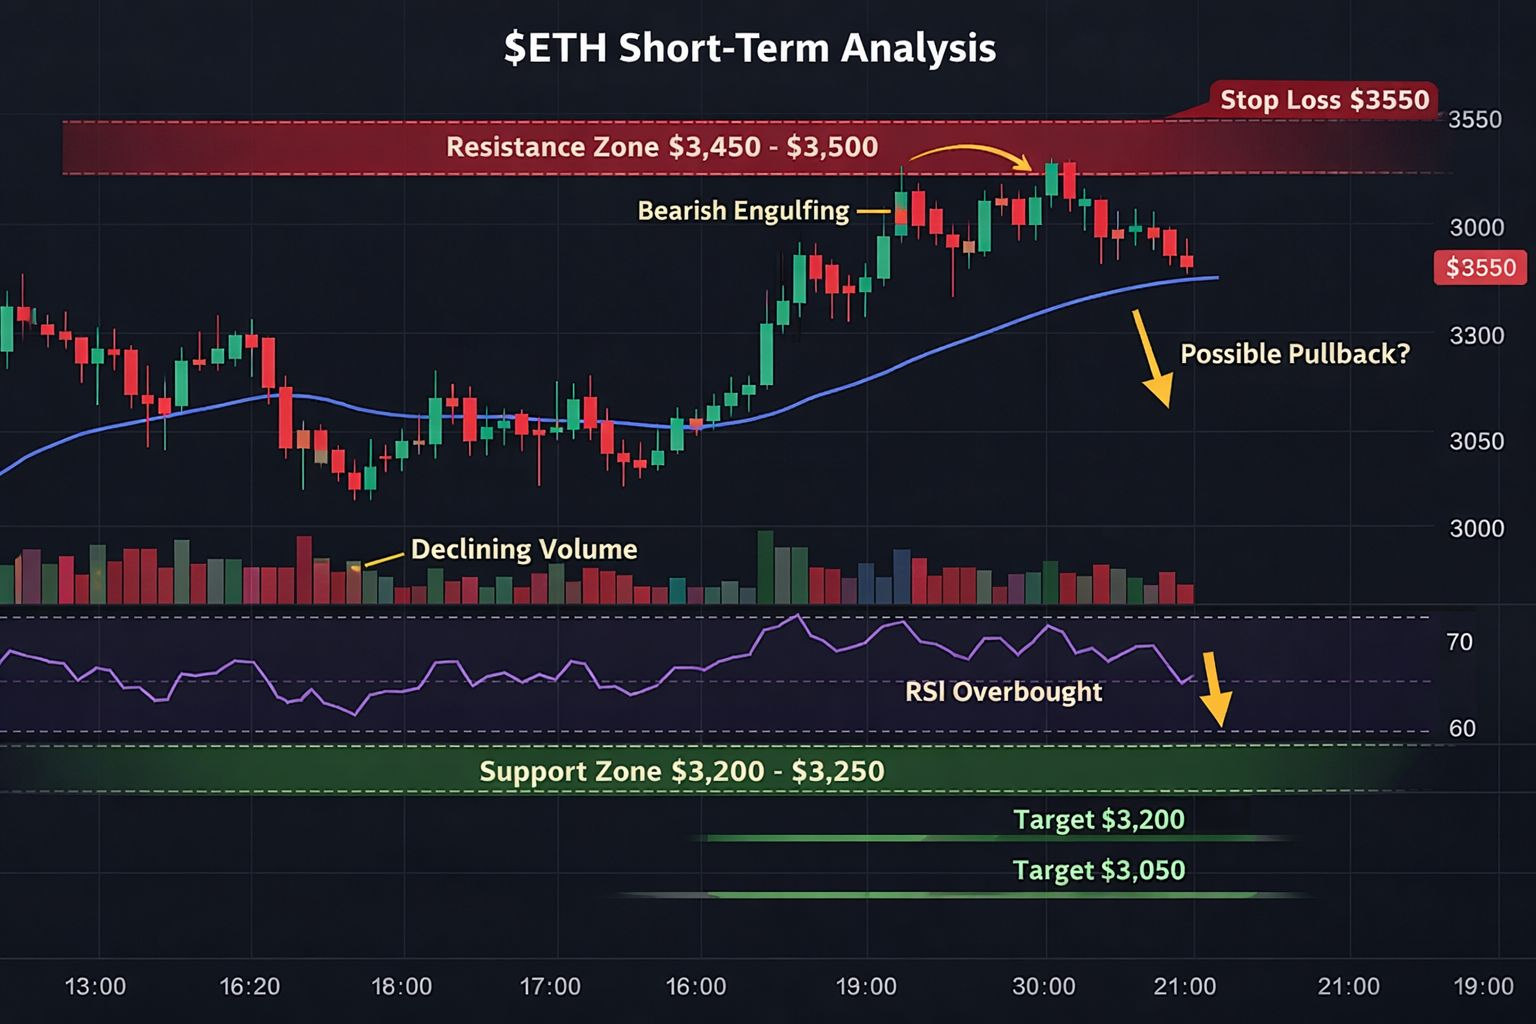
ETH is showing weak bullish momentum fading into consolidation, with signs of a possible short-term pullback.
Key Candlestick Signals:
Recent candles show smaller bodies + long upper wicks → sellers rejecting higher prices
ظهور bearish engulfing / rejection candles near resistance
Volume slightly declining → momentum losing strength
Support & Resistance:
🔻 Support: $3,200 – $3,250 zone
🔺 Resistance: $3,450 – $3,500 zone
Indicators Insight:
RSI hovering near overbought → cooling down
EMA (short-term) acting as dynamic support but weakening
Possible lower high formation → early bearish signal
⚡ Trade Idea (Short Bias)
Entry: Near resistance ($3,400–$3,500 rejection zone)
Target: $3,200 → $3,050
Stop Loss: Above $3,550
🧠 Summary
ETH is currently in a decision zone. If buyers fail to break resistance, a short-term correction is likely. However, a strong breakout with volume would invalidate the bearish setup.