📊 Bitcoin Market Analysis — Daily Chart Insights
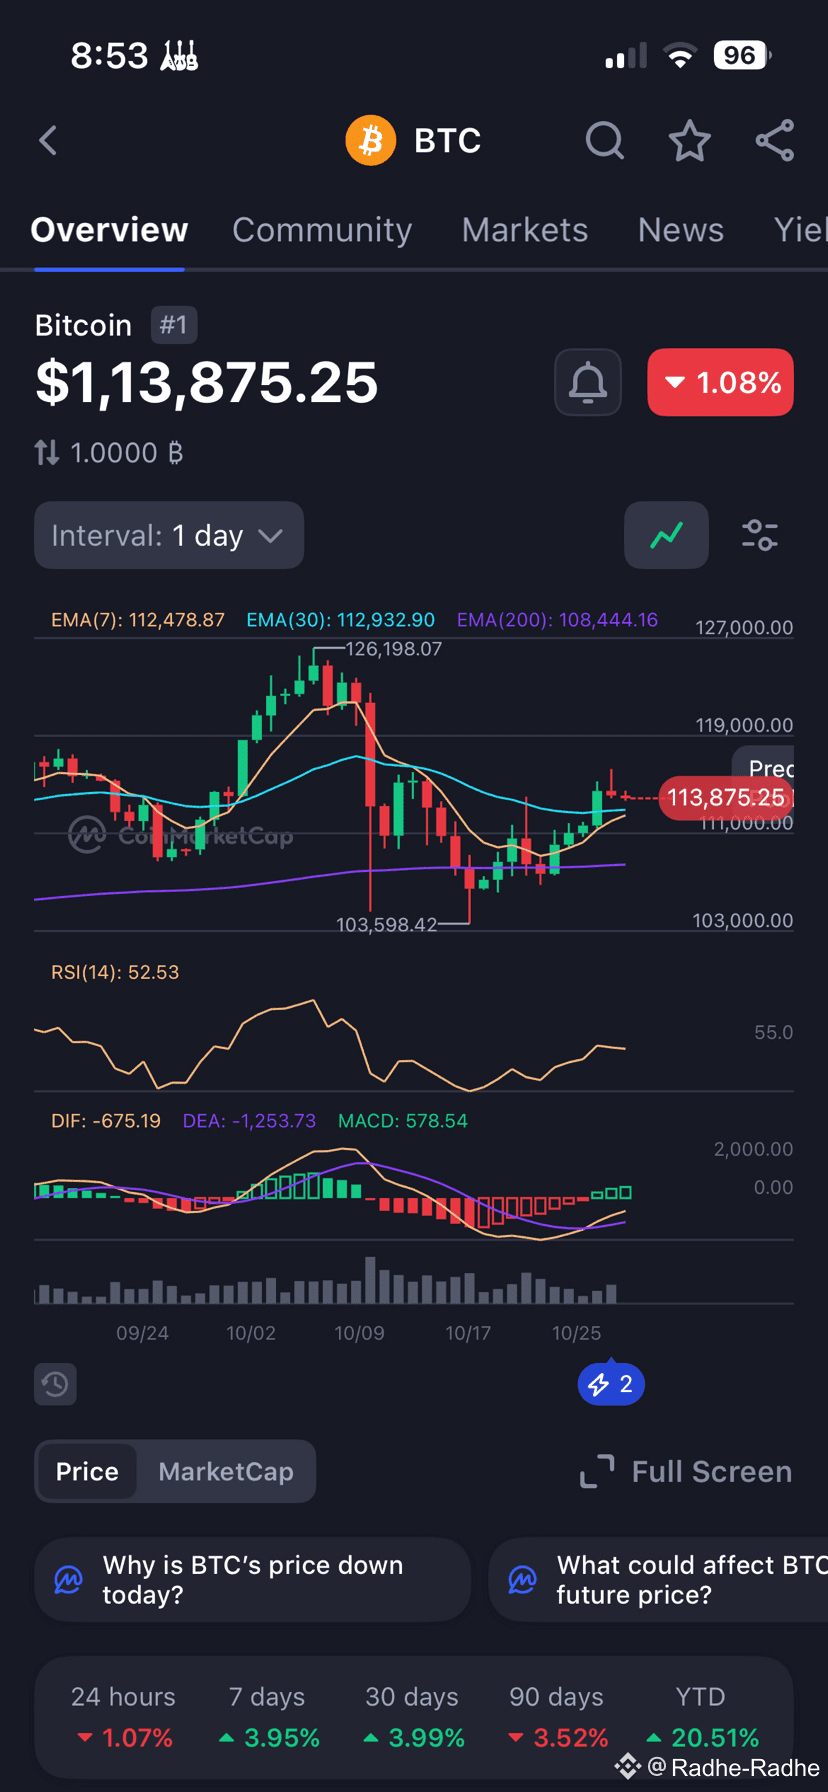
Bitcoin (BTC) is currently trading at $113,875.25, showing a 1.08% decline in the last 24 hours. Let’s decode what this chart is revealing through technical indicators 👇
🔹 1. Price Overview
BTC remains in a steady zone despite a short-term pullback. On the daily (1D) chart, each candlestick represents one full day of trading activity. The current market sentiment is slightly cautious after recent gains.
⸻
🔹 2. Key Moving Averages (EMA)
Three exponential moving averages (EMA) show the trend strength:
• EMA(7): $112,478.87 (short-term trend)
• EMA(30): $112,932.90 (medium-term trend)
• EMA(200): $108,444.16 (long-term trend)
BTC’s current price is above all three EMAs, indicating bullish momentum remains intact in the short and medium term.
⸻
🔹 3. Support & Resistance
• Support: $103,598
• Resistance: $126,198
After bouncing from its recent low near $104K, BTC has stabilized around $113K. Holding above $112K may act as a strong base before attempting a retest toward $119K–$126K levels.
⸻
🔹 4. RSI (Relative Strength Index – 14 days)
Current RSI: 52.53
• RSI < 30 → Oversold
• RSI > 70 → Overbought
A mid-range RSI shows the market is neither overbought nor oversold, reflecting neutral momentum. Traders appear to be waiting for the next decisive move.
⸻
🔹 5. MACD (Momentum Indicator)
• DIF (MACD Line): -675.19
• DEA (Signal Line): -1,253.73
• Histogram: +578.54 (Green)
The positive histogram signals a bullish crossover, meaning buying momentum is building after a short-term downtrend. This often precedes potential upward price continuation if supported by volume.
⸻
🔹 6. Volume & Performance Summary
Trading volume remains steady to slightly increasing, suggesting healthy market participation.
Period Change Sentiment
24 hours 🔻 -1.07% Short-term pullback
7 days 🔼 +3.95% Weekly uptrend
30 days 🔼 +3.99% Monthly uptrend
90 days 🔻 -3.52% Mild correction
YTD 🔼 +20.51% Strong annual growth
⸻
🧭 Final Outlook
Bitcoin shows resilience above the $112K level, maintaining bullish structure with improving MACD signals. Short-term dips like today’s -1% move appear to be healthy corrections in a broader uptrend.
If BTC sustains its current support, a retest toward $119K–$126K remains likely in the near term.
⸻
#Bitcoin #BTC #CryptoMarket #CryptoAnalysis #Blockchain #CryptoInvesting #BTCPrice #DigitalAssets #MACD #RSI #CryptoTrading #TechnicalAnalysis #Fintech #InvestSmart
⸻
