The $PIXEL 500-character chart is basically a compressed trading system that turns complex market behavior into short codes you can read instantly on a chart—kind of like a personal trading language.
Instead of cluttering your screen with too many indicators, you label zones and actions using letters and numbers:
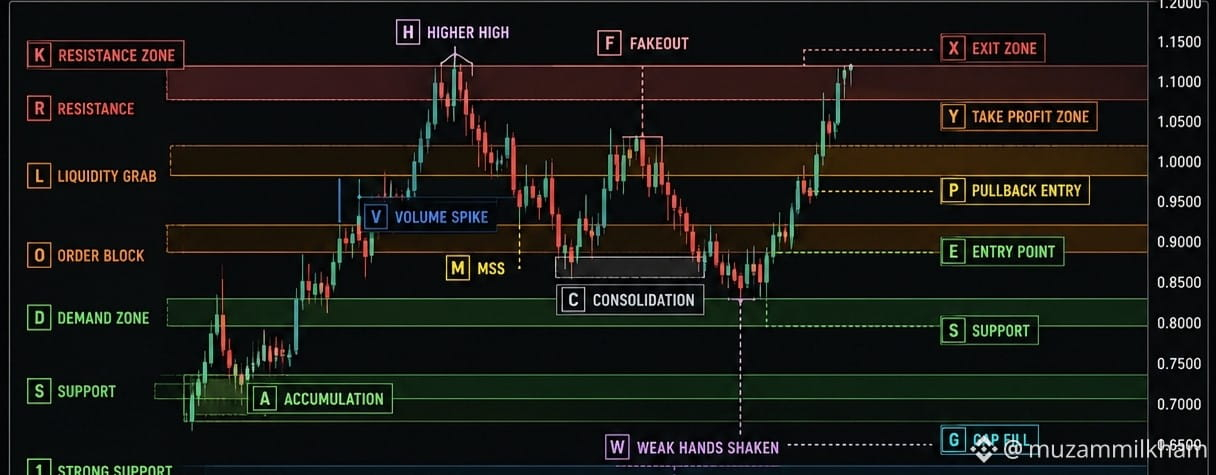
A–Z = Market structure & zones
Example:
A (Accumulation) → where smart money buys
E (Entry) → where you take trades
S (Support) / R (Resistance) → key levels
M (Market Structure Shift) → trend change
X (Exit) / Y (Take Profit) → where you close
1–100 = Trade context & strength
Example:
1–10 → signals (reversal, traps, momentum)
21–40 → intraday/swing setups
61–70 → stop-loss zone
71–80 → take-profit ladders
91–100 → extreme break out/crash zones