📊 Bitcoin Cycle View: Simple Market Structure & Trade Plan
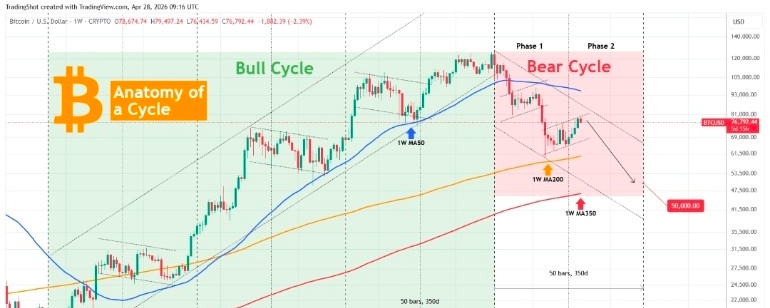
The long-term chart of Bitcoin shows a repeating cycle pattern where price moves in waves of growth and correction. The idea is that the market moves in phases, and each cycle has strong upside followed by deep pullbacks.
👉 Main idea: Market moves in cycles, not straight lines
👉 Current view: Bear phase may be closer to final stage, but not confirmed yet
📉 Key levels (simple structure):
Support zone: long-term demand area near previous major lows
Deep support: final accumulation zone if stronger drop happens
Resistance zone: major highs where selling pressure starts again
📊 Trading strategy:
🟢 Long setup (buy plan):
Enter only at strong support zones with clear bounce
Stop loss: below deep support area
Target: next resistance zone or cycle recovery highs
🔴 Short setup (sell plan):
Enter if price breaks support with strong momentum
Stop loss: above broken structure level
Target: deeper support zones
⏳ Long-term view:
Best buying area is not at the top or middle, but near strong cycle support zones. Patience is important, because cycle bottoms usually take time to form.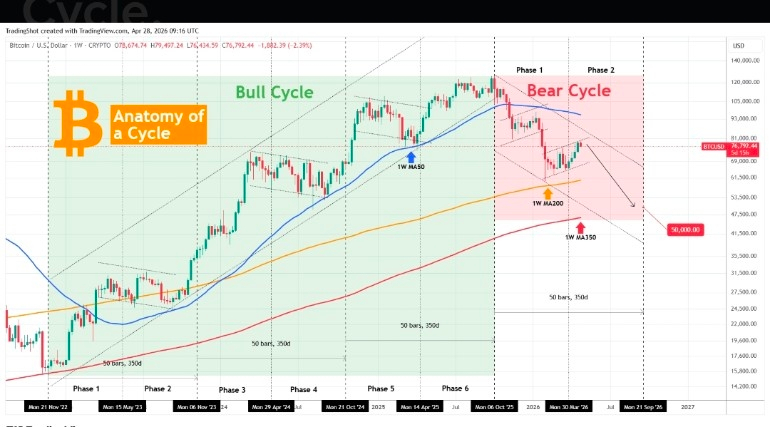
⚖️ Final summary:
Bitcoin moves in long cycles. Smart traders do not chase moves. They wait for support, resistance confirmation, and clear structure before entering the market.