1️⃣ Price Action
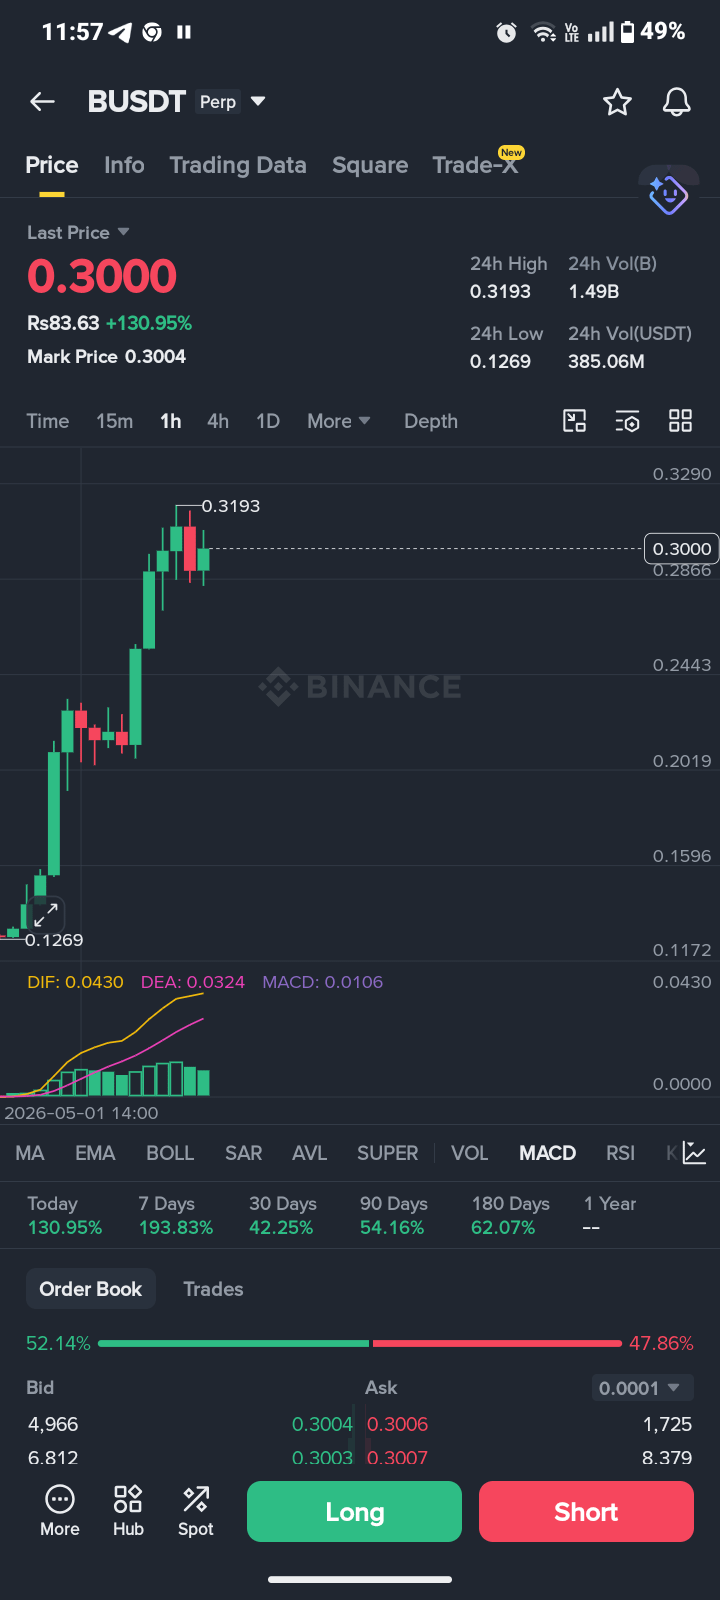
Last price: 0.3000
24h high: 0.3193
24h low: 0.1269
Price abhi 0.3 ke aas-paas hai aur recent candle upar ki taraf bullish dikha raha tha, lekin ab thoda pullback ho raha hai.
Dekh rahe hain ki recent strong bullish move aya hai from 0.1269 → 0.3193, matlab market ne kaafi tezi dikhayi hai.
2️⃣ Candlestick pattern
Green candles ka strong streak hai → short-term momentum bullish hai.
Lekin ab thodi red candles hain → possible profit booking / pullback.
3️⃣ MACD Indicator
DIF (yellow) = 0.0430
DEA (pink) = 0.0324
MACD Histogram = 0.0106 (positive)
Interpretation:
DIF line DEA ke upar hai → bullish signal
Histogram positive → trend abhi bhi uptrend mein hai
Lekin DIF aur DEA thodi flatten ho rahi hain → momentum slow ho raha hai → thoda consolidation ya short-term correction possible hai.
4️⃣ Order Book Sentiment
52.14% buyers vs 47.86% sellers → thoda bullish sentiment, lekin close hai → price easily fluctuate kar sakta hai.
5️⃣ Support & Resistance
Support (recent low): ~0.2866
Resistance (recent high): 0.3193
Agar price 0.3193 break kare → next bullish continuation possible
Agar 0.2866 break kare → short-term bearish correction possible
✅ Summary (Trading Perspective)
Short-term trend: Bullish, lekin momentum slow ho raha hai.
Risk for new longs: Pullback aa sakta hai, entry thoda risky ho sakta hai abhi.
Short trades: Agar price support 0.2866 todta hai → short karna easier ho sakta hai for scalp.
Trading Tip:
Trend abhi up hai, lekin thodi caution lo — momentum lose ho raha hai → short-term scalpers ko thoda wait karna chahiye.
$B #b #Write2Earn #ARB #altcoins #ai
Trade here👇