📊 Technical Analysis Basics — How to Read Candlesticks Like a Pro
Most beginners look at a chart and see noise. Pro traders look at the same chart and see a story.
The difference? Candlestick reading. Here's your complete guide 👇
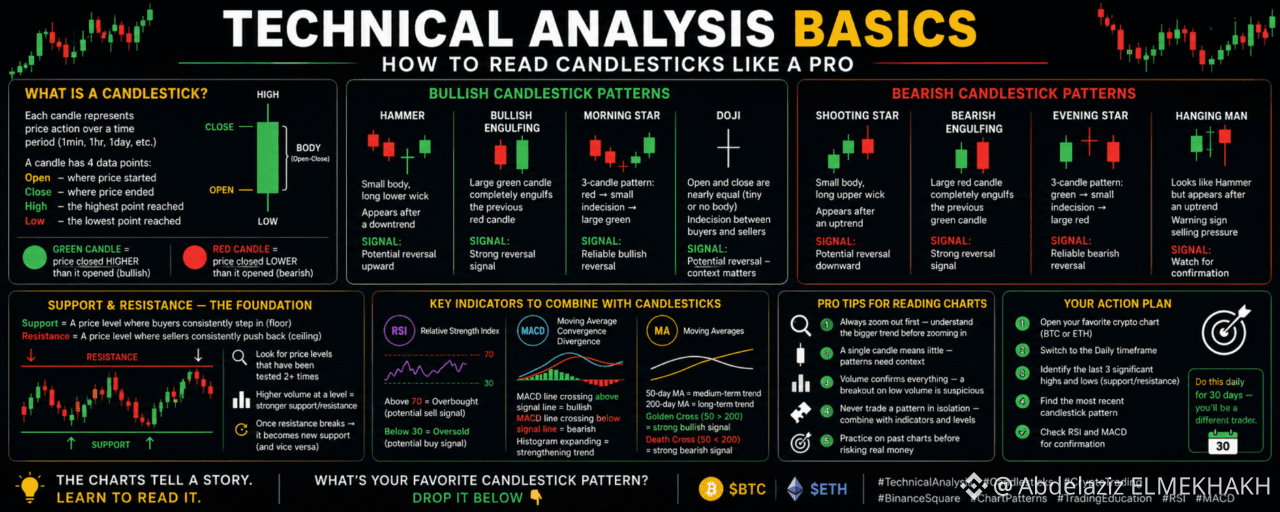
🕯️ WHAT IS A CANDLESTICK?
Each candle represents price action over a time period (1min, 1hr, 1day, etc.)
A candle has 4 data points:
Open — where price started
Close — where price ended
High — the highest point reached
Low — the lowest point reached
🟢 Green candle = price closed HIGHER than it opened (bullish) 🔴 Red candle = price closed LOWER than it opened (bearish)
The body = distance between open and close The wick (shadow) = the high/low beyond the body
📈 BULLISH CANDLESTICK PATTERNS:
🔹 Hammer
Small body, long lower wick
Appears after a downtrend
Meaning: Sellers pushed price down, but buyers fought back strongly
Signal: Potential reversal upward
🔹 Bullish Engulfing
Large green candle completely engulfs the previous red candle
Meaning: Buyers overwhelmed sellers in one session
Signal: Strong reversal signal after a downtrend
🔹 Morning Star
3-candle pattern: red candle → small indecision candle → large green candle
Meaning: Bears losing control, bulls taking over
Signal: One of the most reliable bullish reversals
🔹 Doji
Open and close are nearly equal (tiny or no body)
Meaning: Complete indecision between buyers and sellers
Signal: Potential reversal — direction depends on context
📉 BEARISH CANDLESTICK PATTERNS:
🔸 Shooting Star
Small body, long UPPER wick
Appears after an uptrend
Meaning: Buyers pushed price up, but sellers crushed it back down
Signal: Potential reversal downward
🔸 Bearish Engulfing
Large red candle completely engulfs the previous green candle
Meaning: Sellers overwhelmed buyers in one session
Signal: Strong reversal signal after an uptrend
🔸 Evening Star
3-candle pattern: green candle → small indecision candle → large red candle
Meaning: Bulls losing control, bears taking over
Signal: One of the most reliable bearish reversals
🔸 Hanging Man
Looks identical to a Hammer but appears after an UPTREND
Meaning: Warning sign that selling pressure is building
Signal: Watch for confirmation before shorting
📐 SUPPORT & RESISTANCE — THE FOUNDATION
Support = A price level where buyers consistently step in (floor) Resistance = A price level where sellers consistently push back (ceiling)
How to identify them:
Look for price levels that have been tested 2+ times
Higher volume at a level = stronger support/resistance
Once resistance breaks → it becomes new support (and vice versa)
📊 KEY INDICATORS TO COMBINE WITH CANDLESTICKS:
🔹 RSI (Relative Strength Index)
Above 70 = Overbought (potential sell signal)
Below 30 = Oversold (potential buy signal)
Best combined with reversal candle patterns
🔹 MACD (Moving Average Convergence Divergence)
MACD line crossing above signal line = bullish momentum
MACD line crossing below signal line = bearish momentum
Histogram expanding = strengthening trend
🔹 Moving Averages (MA)
50-day MA = medium-term trend
200-day MA = long-term trend
Golden Cross (50 crosses above 200) = strong bullish signal
Death Cross (50 crosses below 200) = strong bearish signal
💡 PRO TIPS FOR READING CHARTS:
Always zoom out first — understand the bigger trend before zooming in
A single candle means little — patterns need context
Volume confirms everything — a breakout on low volume is suspicious
Never trade a pattern in isolation — combine with indicators and levels
Practice on past charts before risking real money
🎯 YOUR ACTION PLAN:
Open your favorite crypto chart (BTC or ETH)
Switch to the Daily timeframe
Identify the last 3 significant highs and lows (support/resistance)
Find the most recent candlestick pattern
Check RSI and MACD for confirmation
Do this daily for 30 days — you'll be a different trader.
What's your favorite candlestick pattern? Drop it below 👇
$BTC $ETH $BNB #TechnicalAnalysis #cryptotrading #BinanceSquare #tradingeducation #RSI