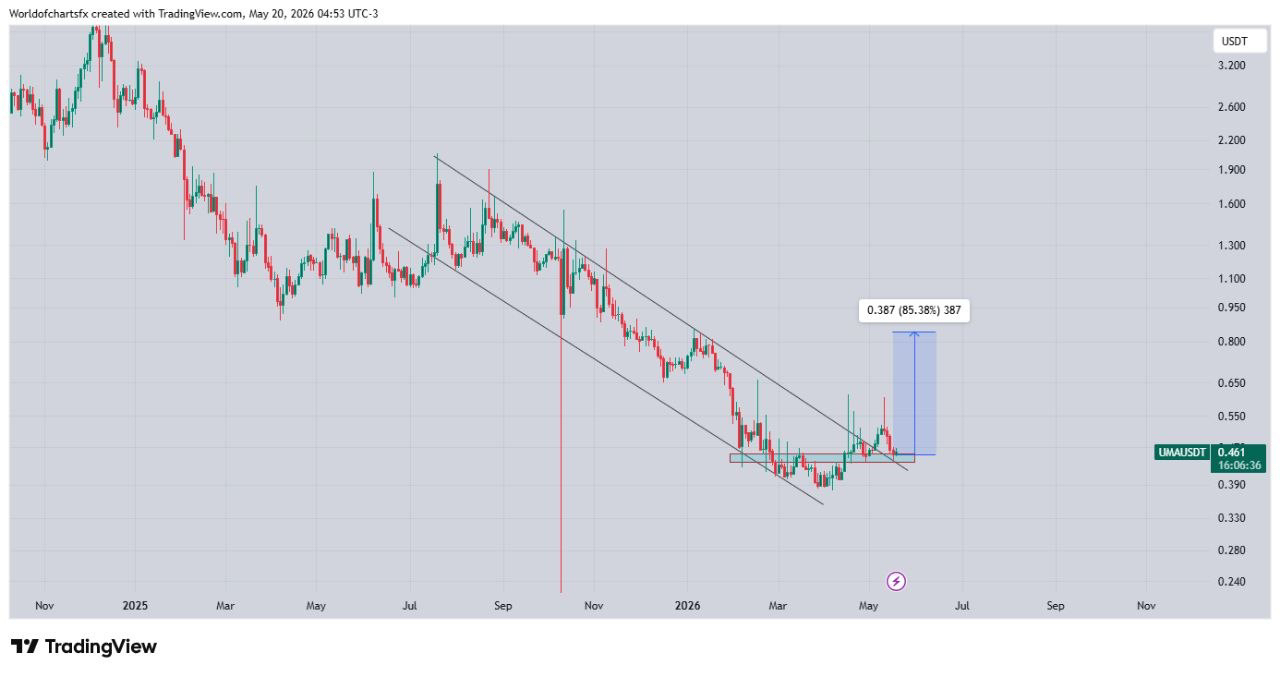

UMA Protocol has just delivered one of the most significant technical breakouts on the altcoin chart. After a brutal 18-month downtrend, the chart is finally showing signs of a major structural shift. Here’s everything you need to know:
📊 Current Price Action
• Price: $0.461 USDT (as of May 20, 2026)
• UMA has been in a relentless descending channel from its late 2024 highs near $3.20, dropping all the way to lows around $0.39–$0.40 by early May 2026
• That’s a peak-to-trough decline of nearly 88% — a full altcoin bear market wipeout
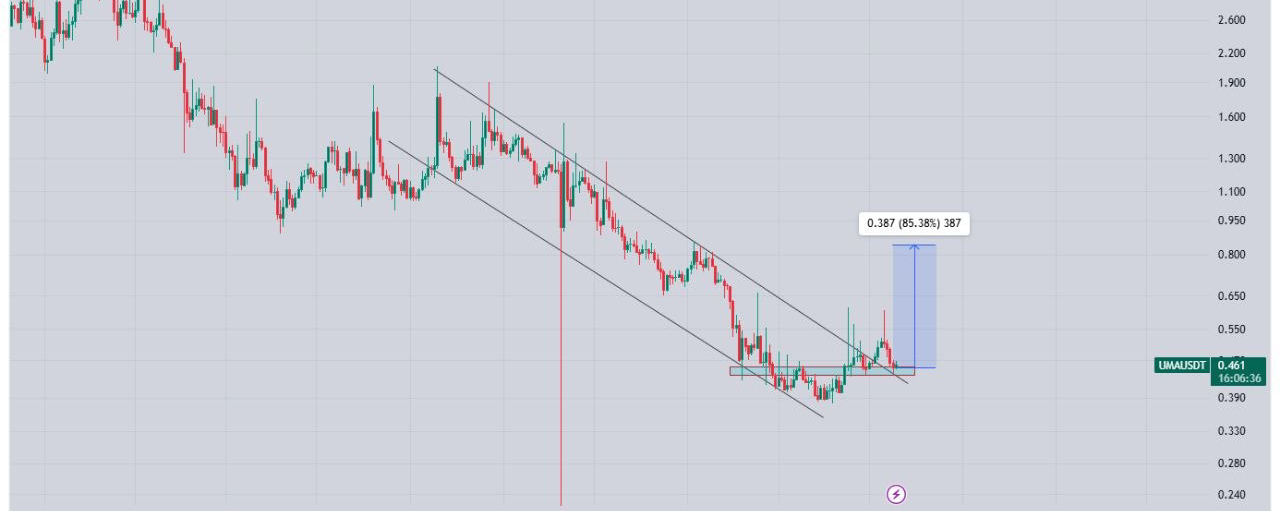
• However, the chart just printed a sharp 85.38% breakout candle (annotated directly on the chart: 0.387 → 85.38% → 387)
📉 The Descending Channel — 18 Months of Pain
The two parallel descending trendlines clearly define the bear channel that dominated UMA’s price action from late 2024 through early 2026:
• Upper resistance line — connecting the series of lower highs from July 2024 onwards
• Lower support line — connecting the series of lower lows, with price consistently respecting the channel bottom
• Every bounce attempt inside this channel was sold into aggressively, trapping bulls repeatedly
This type of structure is called a falling wedge / descending channel, and a breakout from it is considered a high-probability bullish reversal signal in technical analysis.