

NEAR/USDT Technical Analysis (4H Chart)
Current Price: $2.737 (+1.90%)
📊 Indicator Readings
|Indicator |Value |Signal
|-------------------------------------
|SAR (0.02, 0.2) |2.484 🟢 Bullish (price above SAR)|
MA(7) 2.761 🟡 Slight resistance
MA(25) 2.448 🟢 Bullish
MA(99) 1.832 🟢 Strong uptrend
Supertrend (10,3)|2.409 🟢 Bullish
BOLL Upper 2.905 |Resistance target
BOLL Mid 2.538 |Support
BOLL Lower 2.171 |Strong support
MACD DIF/DEA |0.195 / 0.190|🟢 Bullish, but flattening
🔍 Pattern Observations
Bullish Structure (Dominant)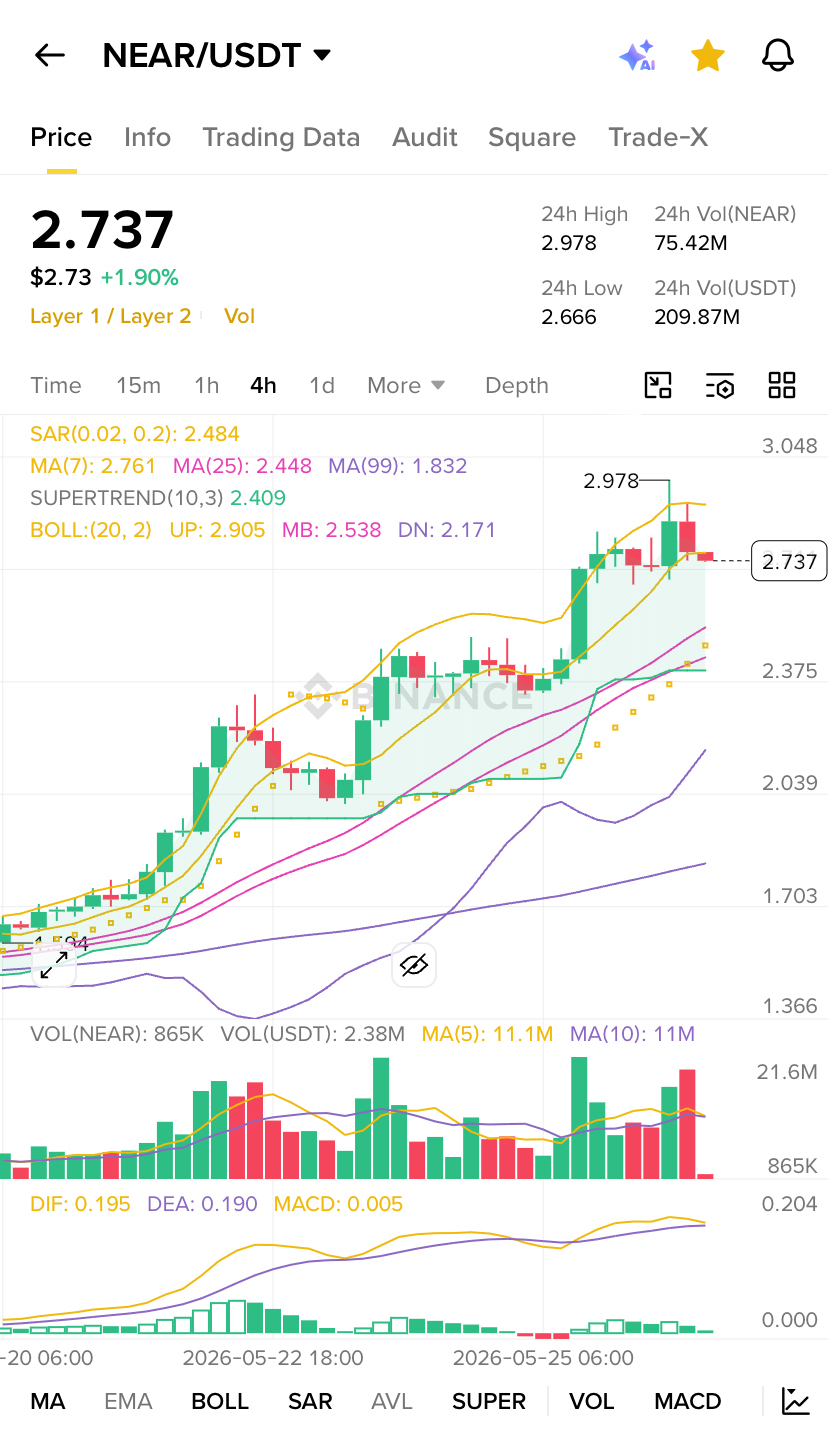
• $NEAR
• All MAs stacked bullishly (MA7 > MA25 > MA99) — classic uptrend alignment
• SAR dots remain well below price, confirming trend integrity
• Supertrend remains green/supportive
Caution Signs
• Price rejected from 2.978 (24h high) and pulled back to 2.737 — a ~8% wick rejection
• Currently sitting below MA(7) at 2.761, which is a mild bearish signal short-term
• MACD histogram is nearly flat (0.005) — momentum is losing steam
• Volume on recent red candles appears elevated — potential distribution
🎯 Probable Next Scenarios
Scenario A — Bullish Continuation (55% probability)
Price consolidates between 2.65–2.76, finds support at MA(7) or Supertrend (~2.409 floor), then pushes toward Bollinger Upper Band at 2.905, with extension target at 3.00–3.05
Scenario B — Short-term Pullback (35% probability)
MACD losing momentum + rejection from ~2.978 triggers a retest of BOLL midband ~2.538 or MA(25). This would be a healthy correction before continuation. Key support: 2.48–2.54 zone
Scenario C — Trend Breakdown (10% probability)
Break below Supertrend (2.409) and SAR (2.484) would invalidate the bullish structure, targeting 2.17 (BOLL lower) or lower
🧭 Key Levels to Watch
• Resistance: 2.761 (MA7) → 2.905 (BOLL Upper) → 2.978 / 3.00
• Support: 2.538 (BOLL Mid) → 2.484 (SAR) → 2.409 (Supertrend)
⚠️ This is technical analysis for informational purposes only, not financial advice. Crypto markets are highly volatile — always manage risk accordingly.