
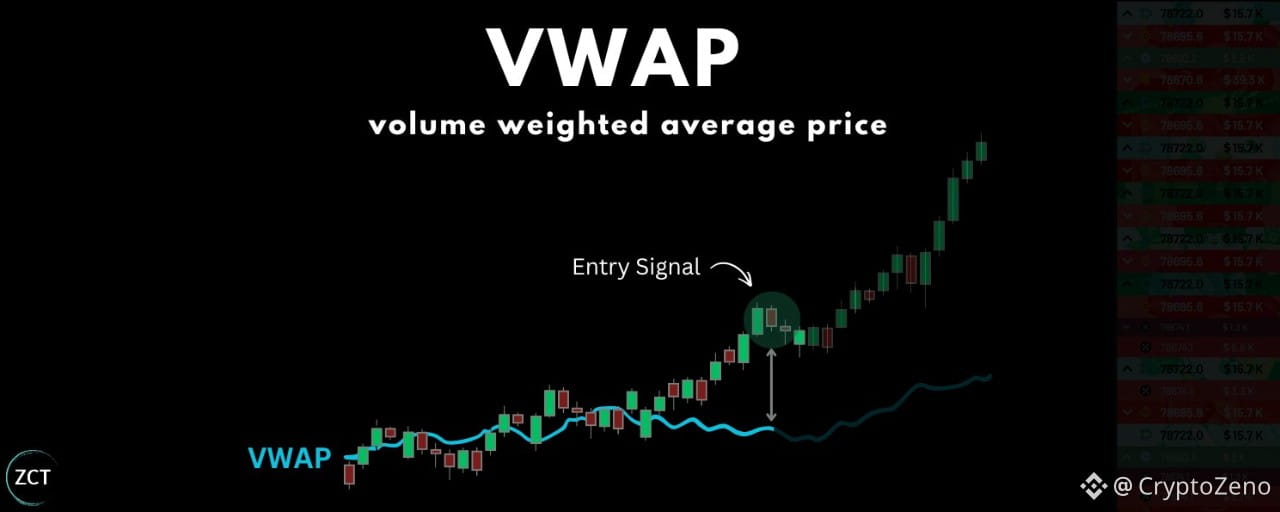
VWAP doesn't need to be complicated.
I'll use my 9 years of trading experience to give you the most practical VWAP guide on the internet.
This is a full guide with real examples, not just theory.
Let’s begin.
Lesson 1: What is VWAP?
VWAP = Volume Weighted Average Price
Instead of treating every price move equally, it weights the price by trading volume to show you the real average price of the day
Think of it as an anchor price that the market is gravitating around
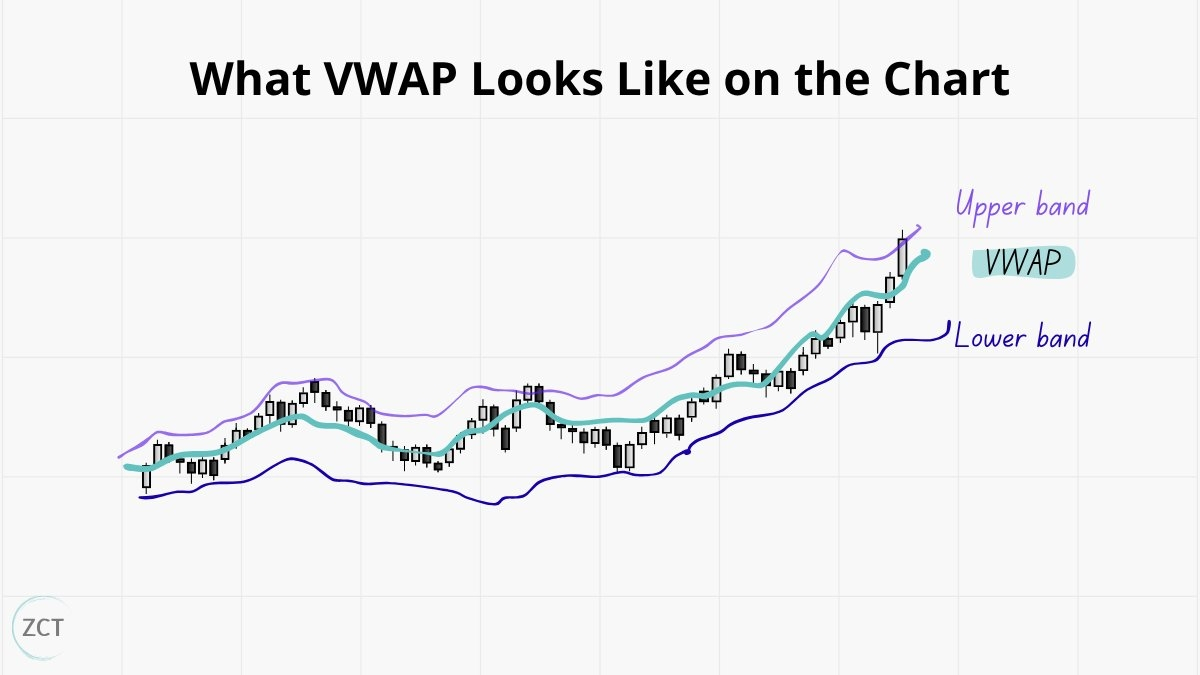
Here’s what VWAP looks like on the charts:
The blue line is VWAP: the true average price adjusted for volume
The purple bands expand 1 standard deviation above (upper band) and 1 standard deviation below (lower band) the VWAP to show how far the price is stretching from that average
Why VWAP matters
Random spikes/dumps can trick you if no volume is behind them
VWAP filters that noise and shows where the real market commitment is
Example: if 90% of trades happen at $10 but the price briefly spikes to $12, VWAP stays near $10. Reflecting the fact that the upward move was only a quick deviation from the overall trend.
Here are my TradingView settings for VWAP
Anchor: Session (resets daily)
Bands: ±1 standard deviation
Style: VWAP in light blue and bands in dark blue/ purple
VWAP acts as the anchor price for the day, while the bands show how far the price is deviating from that anchor
This is our base before applying VWAP in real trades
3 Key Signals of VWAP
When it comes to VWAP, isolate 3 key signals for your analysis.
1. Position of VWAP <> Price: Breakouts or breakdowns?
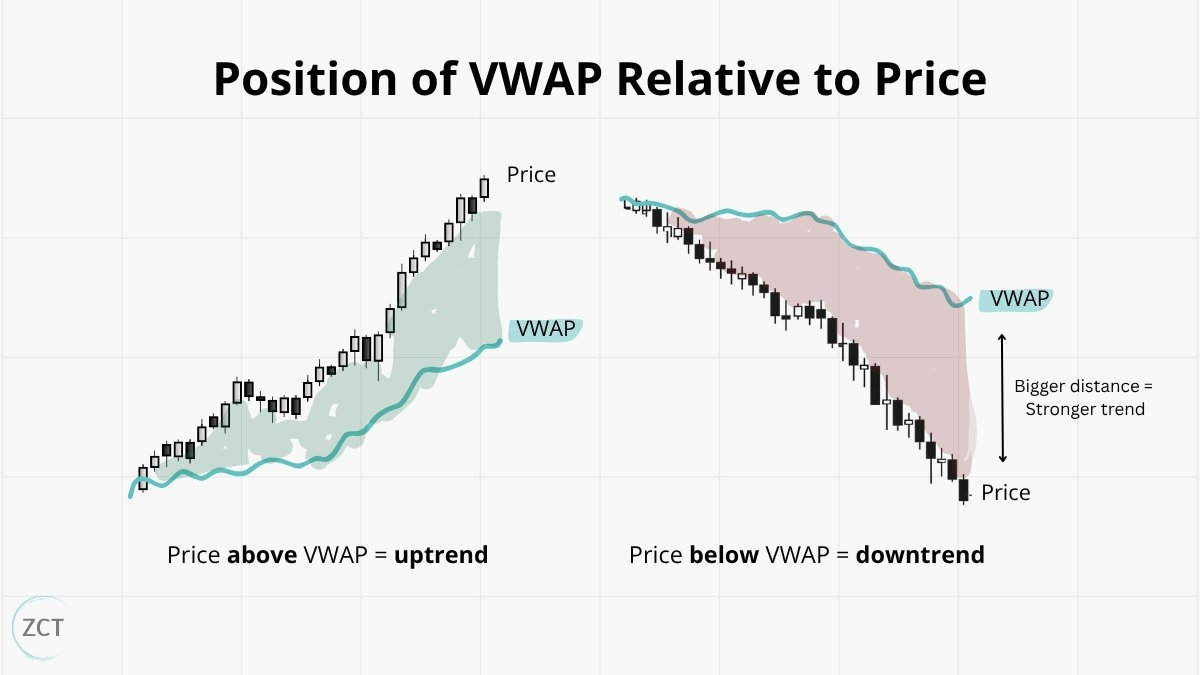
Price trending above VWAP = strong uptrend = favours breakouts (momentum longs)
Price trending below VWAP = strong downtrend = favours breakdowns (momentum shorts)
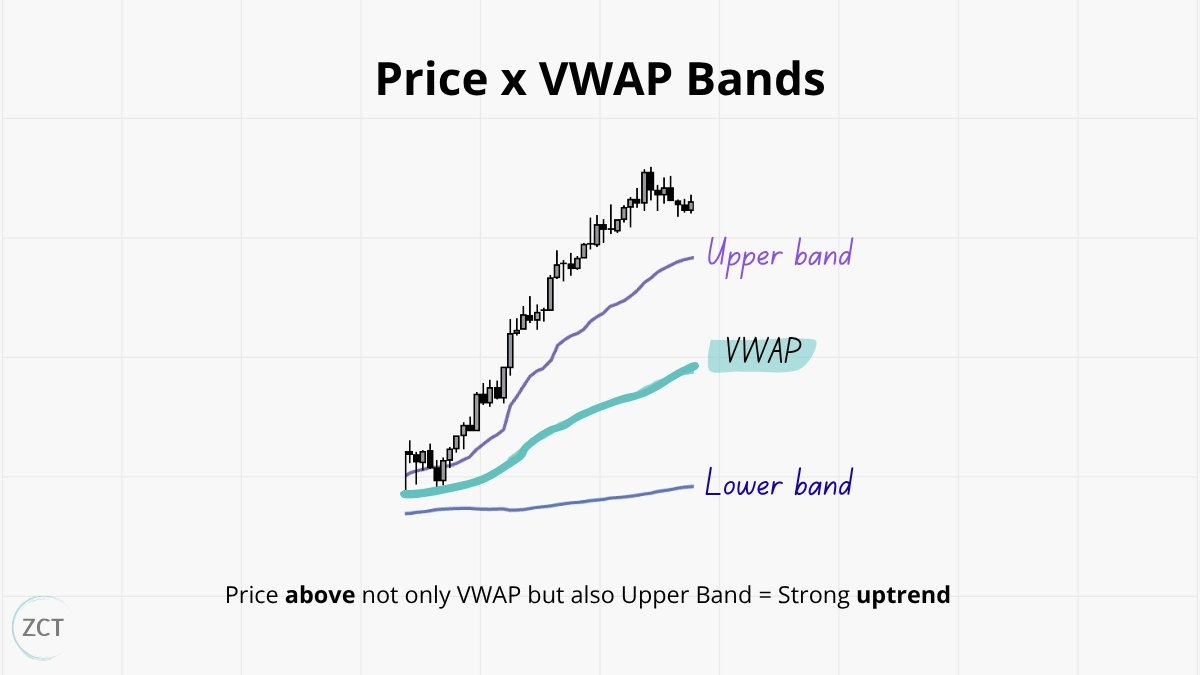
BONUS: We can also consider the position of price relative to the lower and upper bands. In an uptrend, if the price is above both the VWAP and the upper band, there is even more strength in the uptrend. Similarly, in a downtrend, if the price is below both the VWAP and the lower band, there is more strength in the downtrend.
2. The slope of the VWAP: Is price trending or ranging?
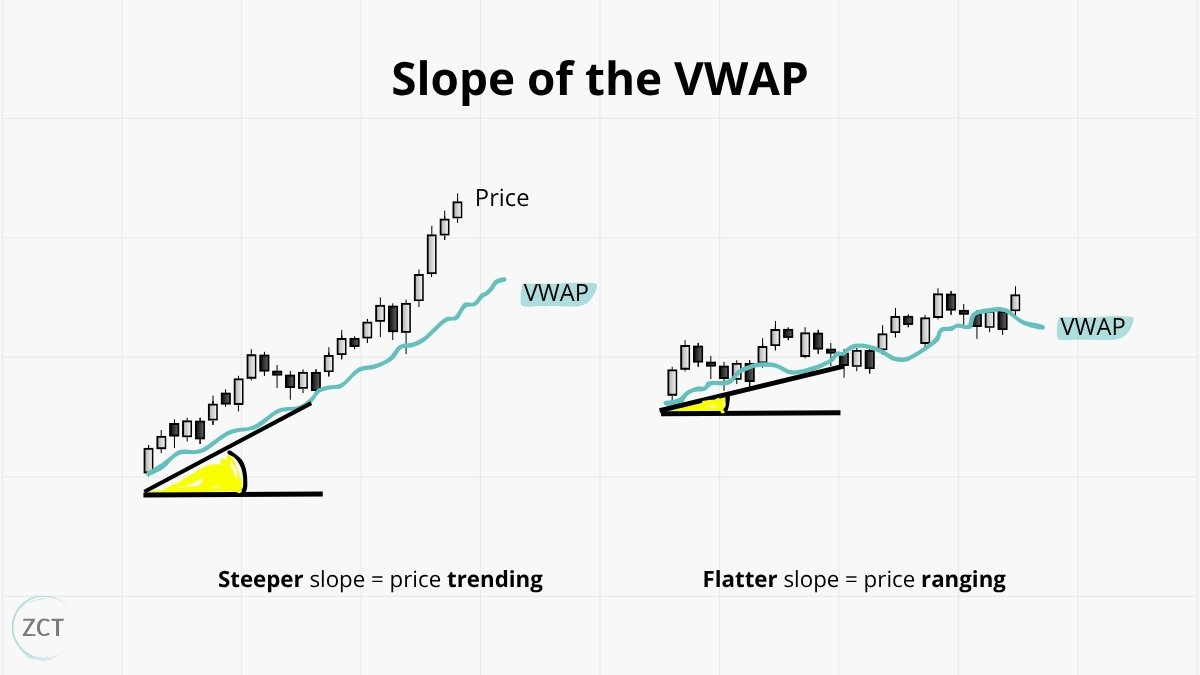
This shows you the direction and conviction behind a move. The steeper the slope, the more aggressive a trend is, making it simpler to take trades in that direction.
Steeper slope = price trending = favours momentum trades
Flat slope = price ranging = favours reversal trades
BONUS: another observation we can make with the slope of the VWAP is the number of crossovers. How many times does the VWAP cross over the price? This is an additional confluence point whereby fewer crossovers favour momentum.
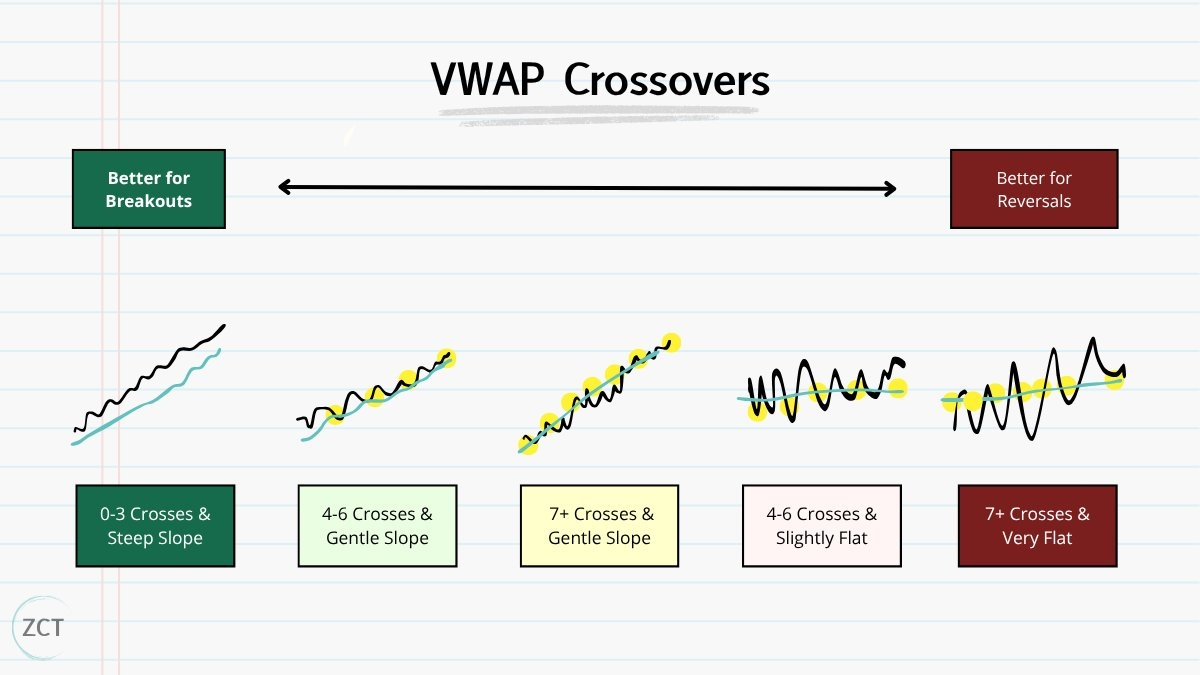
3. VWAP Bands = Is continuation or reversal more likely?
When bands widen, it means price is pulling away from VWAP with momentum. When bands tighten, it means the market is hesitating, and momentum is fading.
Wide bands = strength behind the move = favours continuation = trade momentum
Tight bands = weakness behind the move = favours reversals = trade mean reversion
Lesson 1: VWAP Summary
VWAP (Volume Weighted Average Price) = the true average price of the day, weighted by volume, not just price movement
Acts as an anchor price the market gravitates around, filtering out low-volume spikes and noise
The bands sit ±1 standard deviation above/below VWAP, showing how far the price is stretching from the average
3 Key Signals:
Price vs. VWAP. Above = uptrend, below = downtrend
Slope. Steeper = price trending, flat = price ranging
Bandwidth. Wide = strength behind the move, tight = weakness behind the move
BONUS: Find Out Your Trading Level
Just a quick note here to say I recommend that traders introduce indicators like VWAP when they reach level 3 in my trader roadmap.
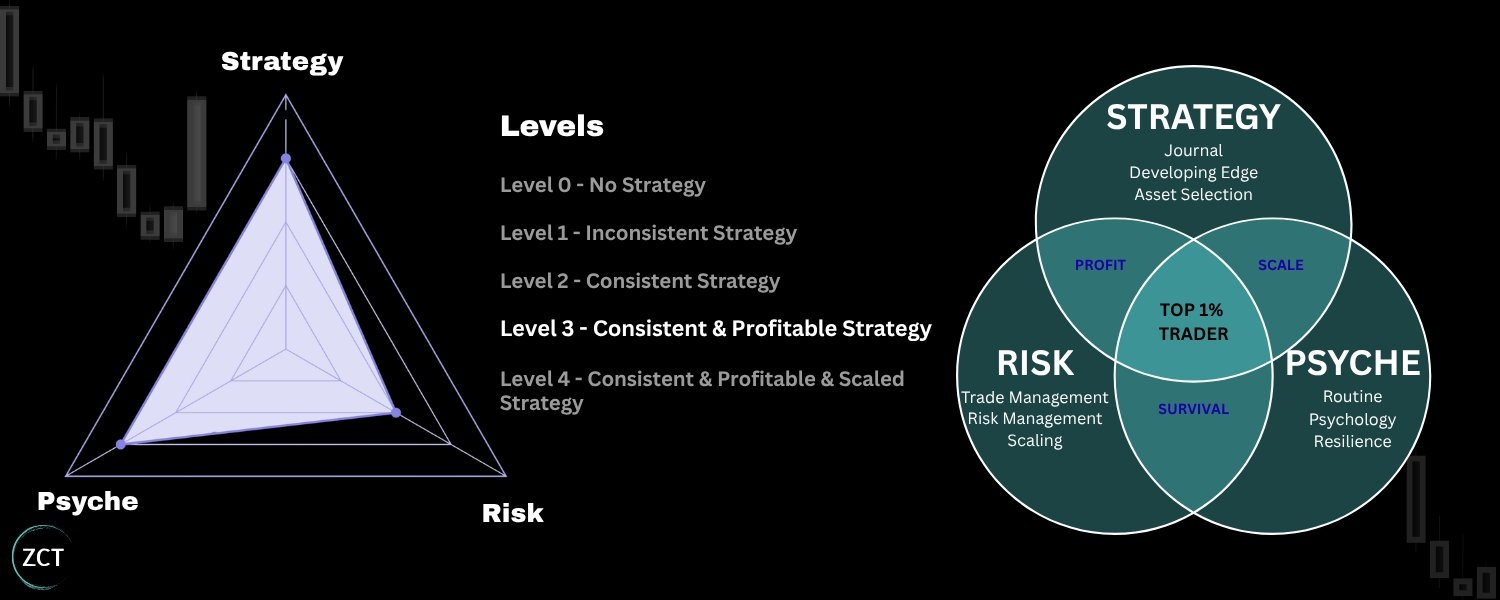
If you want:
To find out your personal trading level
A personalised gameplan from my team on how to improve (for free)
Lesson 2: VWAP for Breakout Strategies
When you take a momentum trade, you are essentially betting on a continuation of the trend
In a breakout strategy, that is, a continued uptrend
In a breakdown strategy, that is, a continued downtrend
So we look to the VWAP for clues of strength in the trend. Recapping what was covered in the last section:
1. Directional bias
Price trending above VWAP = strong uptrend = favours breakouts (momentum longs)
Price trending below VWAP = strong downtrend = favours breakdowns (momentum shorts)
2. Strategy bias
Steeper VWAP slope = price trending = favours momentum trades
Wide VWAP bands = strength behind the move = favours continuation = trade momentum
Now, let’s consider some real trade examples
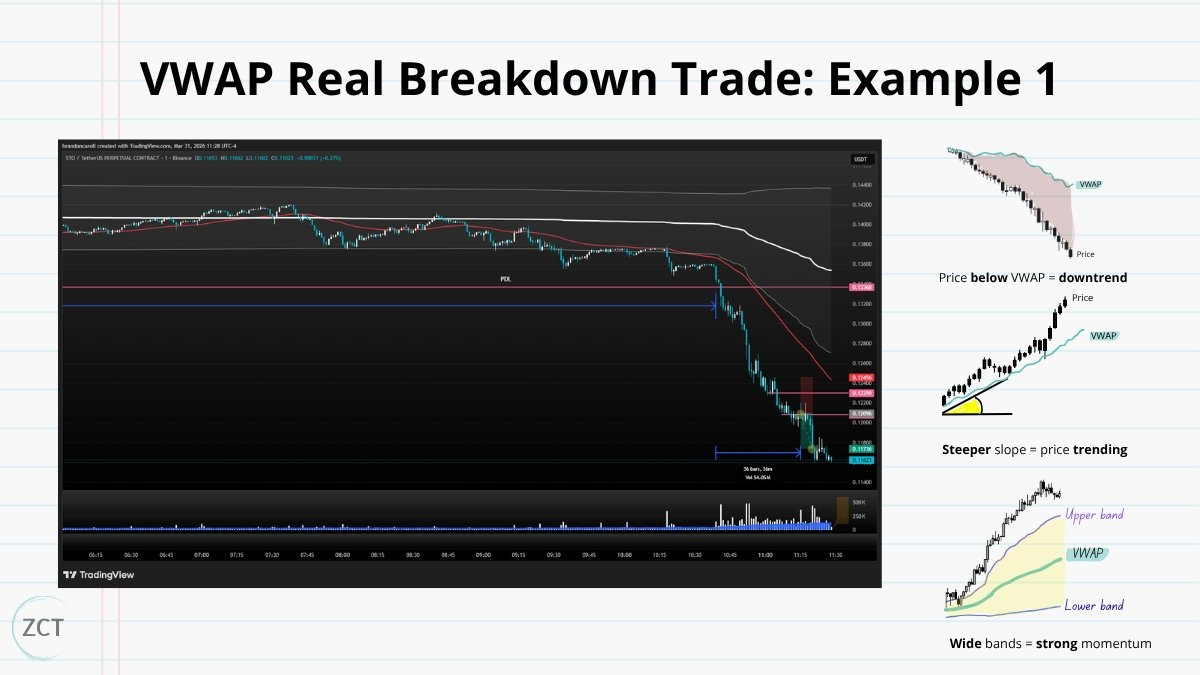
Super clean breakdown trade from Brandon here
Directional bias is a downtrend with price trending below both the VWAP and the lower band too
In terms of strategy bias, we can see that right as price approaches the previous day's low, the slope of the VWAP steepens, and the bands of the VWAP widen
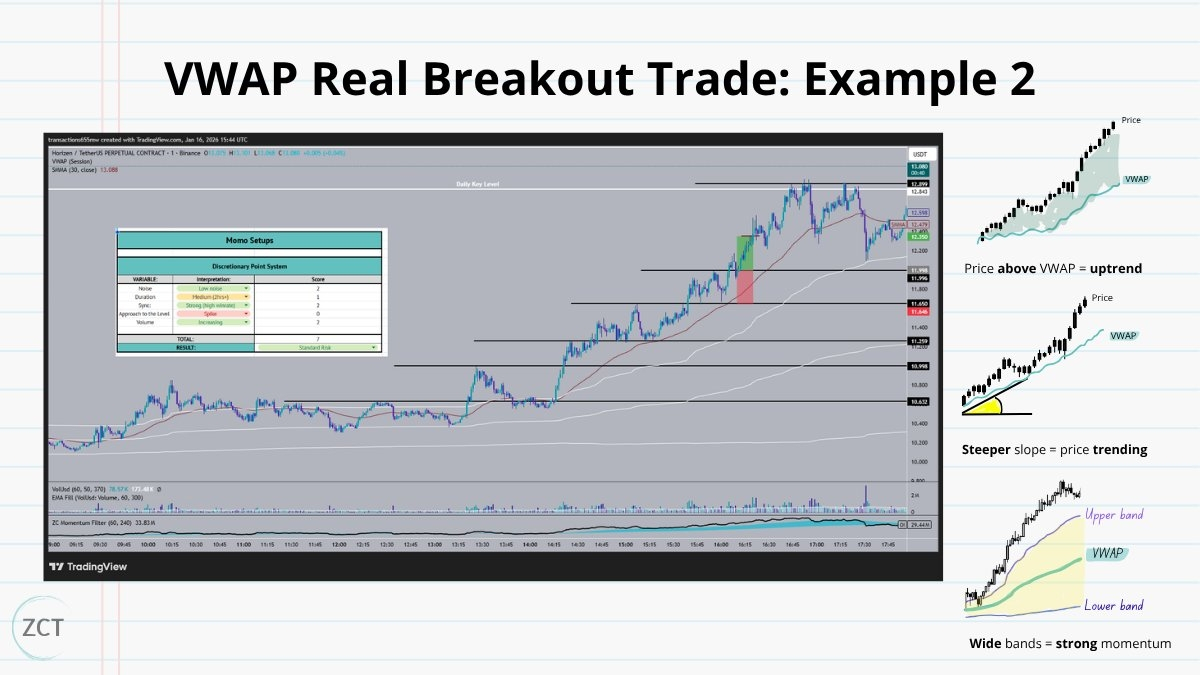
This example is from coach Josh on my team
Some traders may have thought they ‘missed’ the move here. However, in crypto, a lot of the time, the price continues to run higher
By observing the steep slope of the VWAP and the continued widening of the bands, Josh was able to grab a momentum trade in this uptrend (as indicated by price trending above both VWAP and the upper band).
Lesson 2: VWAP for Breakout Strategies Summary
Momentum trades = betting on trend continuation. Uptrend in a breakout, downtrend in a breakdown
Look to VWAP for signs of trend strength before entering
Two key signals that favour continuation:
1. Steeper VWAP slope = price trending = favours momentum trades
2. Wide VWAP bands = strength behind the move = favours continuation = trade momentum
Price position confirms direction. Above VWAP for longs, below for shorts
Lesson 3: VWAP for Reversal Strategies
When you take a reversal trade, you are basically betting on a reversal of the trend
So in the VWAP, we want to see evidence of weakening of the trend.
Strategy bias:
Flat slope = price ranging = favours reversal trades
Tight bands = weakness behind the move = favours reversals = trade mean reversion
VWAP is telling you that the market is choppy, and this is where reversal trades perform best
Now, let’s consider some real trade examples
Brandon captured an excellent reversal short here.
You can see that the bands of the VWAP are tight, forming a close range and the slope of the VWAP is almost entirely flat
In this trade example, Kim avoided the fakeout
Despite the price moving higher in what may have looked like a continuation play, he observed that the VWAP stayed in a tight range with a flat slope. Notice in this example that there are also multiple crossovers of the VWAP with the price
He was able to appropriately classify this as a reversal play