Got it, looks like you want me to break down this BTCUSDT chart and talk through what it might mean going forward.
*What the chart shows right now*
*Current snapshot*
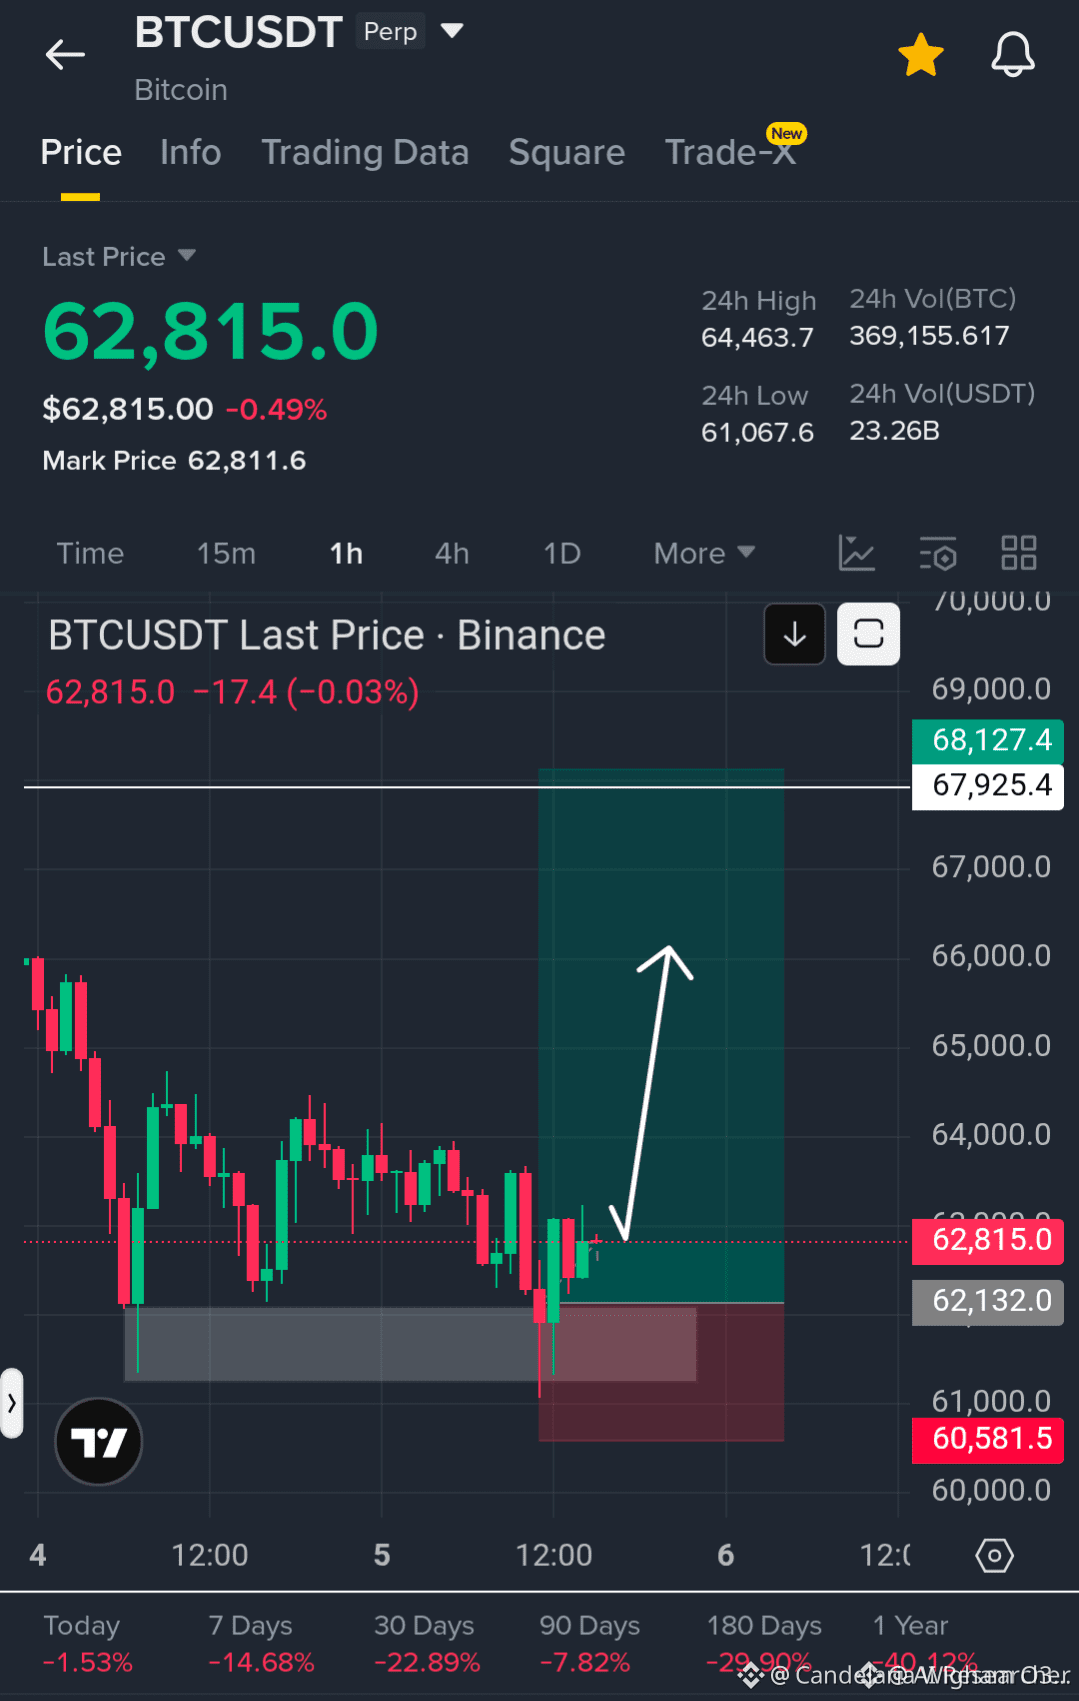
- *Pair*: BTCUSDT Perpetual on Binance
- *Last Price*: $62,815.0, down -0.49%
- *24h Range*: High $64,463.7 / Low $61,067.6
- *24h Volume*: 369,155 BTC / $23.26B USDT
- *Timeframe*: 1h chart, showing roughly 4th to 6th
*Trend context at bottom*: All red lately
- Today: -1.53%
- 7 Days: -14.68%
- 30 Days: -22.89%
- 180 Days: -29.90%
- 1 Year: -40.12%
So the bigger picture has been bearish, but this chart is zoomed in on a short-term setup.
*Technical details drawn on the chart*
1. *Support zone*: Gray box around $61,000 - $62,132. Price dipped into it and bounced. That area held as demand.
2. *Stop/target box*: Green/red shaded area with white arrow. This looks like a trade idea:
- *Entry*: Near current price $62,815
- *Stop loss*: Red zone down to ∼$60,581.5
- *Target*: Green zone up to ∼$67,925 - $68,127
- *Risk/Reward*: Roughly $2,200 risk vs $5,100 reward, about 1:2.3 R:R
3. *Resistance above*: Clear horizontal level at $68,127.4 marked in teal. Price would need to clear $64,463 24h high first.
4. *Candles*: Recent 1h candles show rejection wicks below $62k, then small green candles. That’s buyers stepping in after the drop.
*“Future details” - what to watch*
I can’t predict price, but here’s what this setup implies and the key levels:
*If bullish scenario plays out*
1. *Must hold*: $62,132 gray zone. If 1h candles keep closing above it, buyers are defending.
2. *First hurdle*: $64,463 24h high. Break + retest there opens the path higher.
3. *Target zone*: $67,925 - $68,127. That’s the top of the green box and a major resistance. Expect sellers there.
*If it fails*
1. *Break below $61,067*: That’s the 24h low. Losing it invalidates the bounce idea from the gray box.
2. *Next support*: $60,581 stop level marked. Below that, the downtrend from the 7d/30d stats resumes.
*Other factors*
- *Volume*: $23.26B in 24h is heavy. Moves on high volume are more likely to follow through.
- *Downtrend*: Zoom out and BTC is still -14% this week. Counter-trend bounces like this can be sharp but fail fast.
This is general market education, not financial advice. Crypto is volatile and you can lose money fast, especially on leverage/Perps. If you’re trading, position size and risk management matter more than the chart pattern.
Want me to map out how RSI, moving averages, or other indicators would look on this 1h chart?