Ethereum ($ETH ) memasuki akhir pekan terjebak tepat di bawah resistensi saluran tren kuncinya, dan semua sinyal saat ini menunjukkan fase rendah-volatilitas yang terikat pada rentang daripada breakout yang tegas. Struktur pasar, perilaku volume, dan pola historis sedang menyelaraskan menuju konsolidasi.
🔍 Konteks Pasar — Mengapa Akhir Pekan yang Tenang Adalah Kasus Dasar
Pasar kripto, termasuk Ethereum, jarang memberikan breakout saluran utama pada akhir pekan, terutama ketika beberapa kondisi berkumpul bersama:
📉 Volume perdagangan menurun
💧 Likuiditas tipis menjelang akhir tahun
🧩 Kurangnya struktur impulsif pada kerangka waktu yang lebih rendah
Pengaturan tepat ini sekarang terlihat pada grafik ETH, memperkuat harapan pergerakan menyamping daripada langkah yang menentukan tren
📊 Status Saluran Tren & Bias Kerangka Waktu Lebih Tinggi
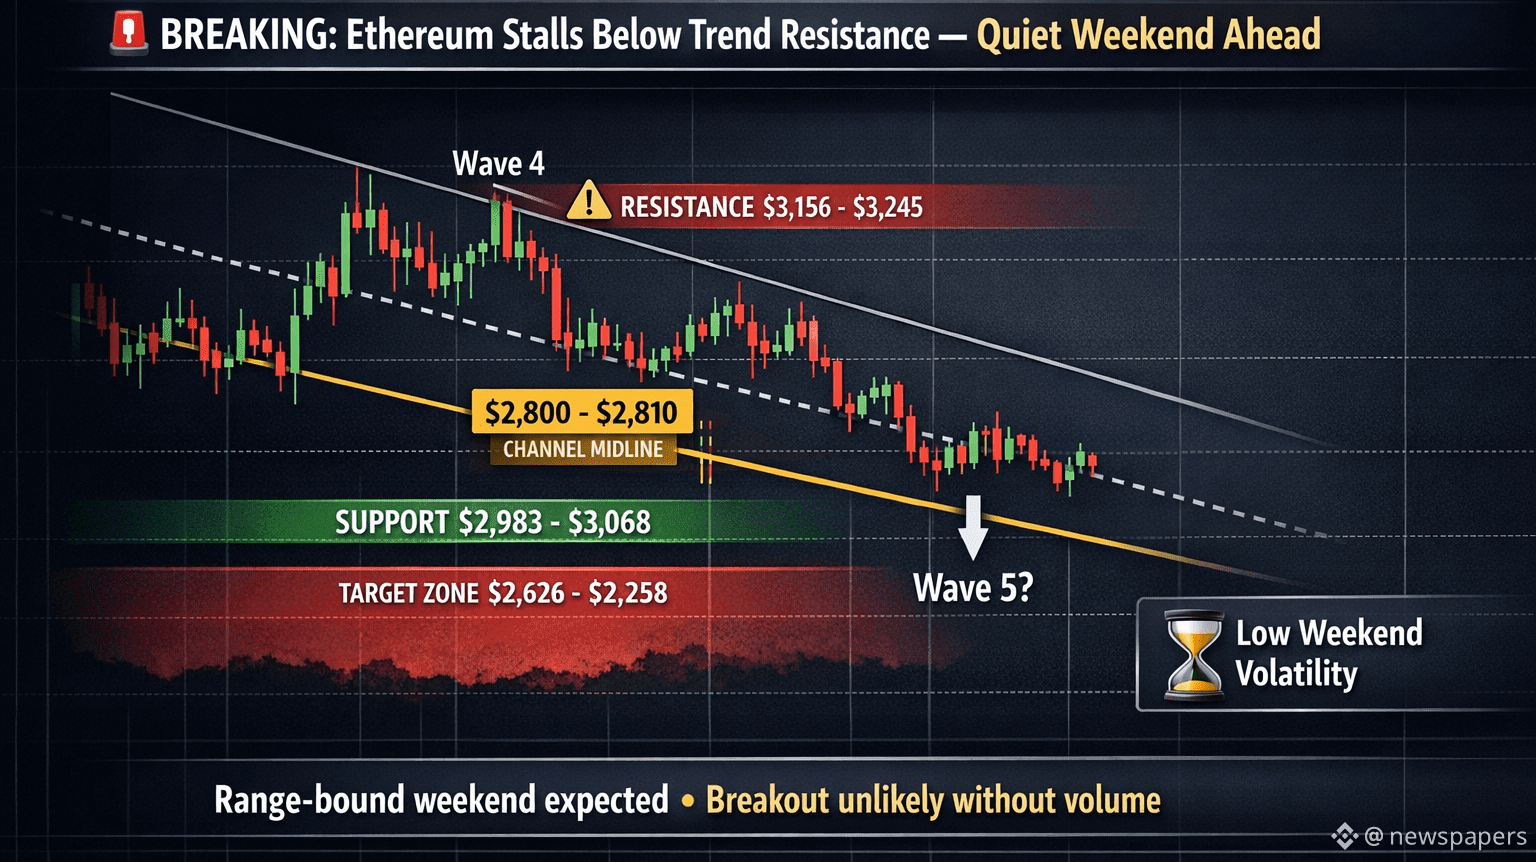
$ETH tetap di bawah batas atas saluran tren yang lebih luas, sementara masih bertahan di atas titik tengah saluran, saat ini dekat:
$2,800 – $2,810
⚠️ Patah bersih di bawah garis tengah ini akan secara material meningkatkan probabilitas kelanjutan penurunan yang lebih dalam.
🔽 Zona Risiko Penurunan (Skenario Gelombang 5)
Jika momentum bearish terkonfirmasi, zona target logis berikutnya berada di:
$2,626 – $2,258
Pada titik ini, puncak makro belum terkonfirmasi, tetapi tanda peringatan awal menunjukkan bahwa struktur korektif sebelumnya mungkin sudah lengkap.
🌊 Pandangan Gelombang Elliott — Dua Skenario yang Sedang Berjalan
🟡 Skenario 1: Kelanjutan Bearish (Hitungan Kuning)
Gelombang 4 kemungkinan berakhir di titik terendah 21 November
ETH mungkin sekarang sedang memasuki penurunan impulsif Gelombang 5
Struktur akan berkembang sebagai gerakan lima gelombang ke bawah
🔑 Tingkat Konfirmasi: Di Bawah $2,800
🔵 Skenario 2: Alternatif Diagonal Bullish
21 November mungkin sudah menandai titik bawah yang berarti
Polanya diagonal mungkin sedang berkembang
Struktur tidak ideal, tetapi masih valid jika terkonfirmasi
🔑 Tingkat Konfirmasi: Patah yang bertahan di atas $3,245
---
⏱ Kisaran Perdagangan Akhir Pekan — Tingkat Kunci untuk Dipantau
$ETH terus menghormati kisaran akhir pekan volume rendah yang klasik:
🟢 Zona Dukungan:
$2,983 – $3,068
Harga sudah bereaksi positif dari area ini
🔴 Zona Resistensi:
$3,156 – $3,245
Berkonvergensi dengan batas saluran tren atas
Aksi harga saat ini paling baik diinterpretasikan sebagai pantulan korektif (Gelombang 2) dalam struktur bearish yang lebih luas — bukan awal dari reli impulsif baru.
📈 Peningkatan volatilitas adalah
kemungkinan terlambat Minggu, tetapi sampai saat itu, perdagangan di kisaran tetap menjadi hasil yang lebih mungkin.