📊
Bitcoin is currently testing crucial support levels in the $63,000 – $64,000 range. Despite recent institutional outflows and the temporary capital shift toward AI tech stocks, on-chain fundamentals show a very different, highly constructive picture.
📰 Fresh News on the Radar:
Liquidity Shift: Top analysts indicate that global liquidity is nearing a cycle bottom. With the U.S. dollar strength stabilizing, the downside risk for crypto appears heavily limited from here.
Supply Shock Preparing: While short-term sentiment remains cautious, Bitcoin exchange balances have quietly dropped to lows last seen in 2019. Long-term holders are aggressively absorbing the supply.
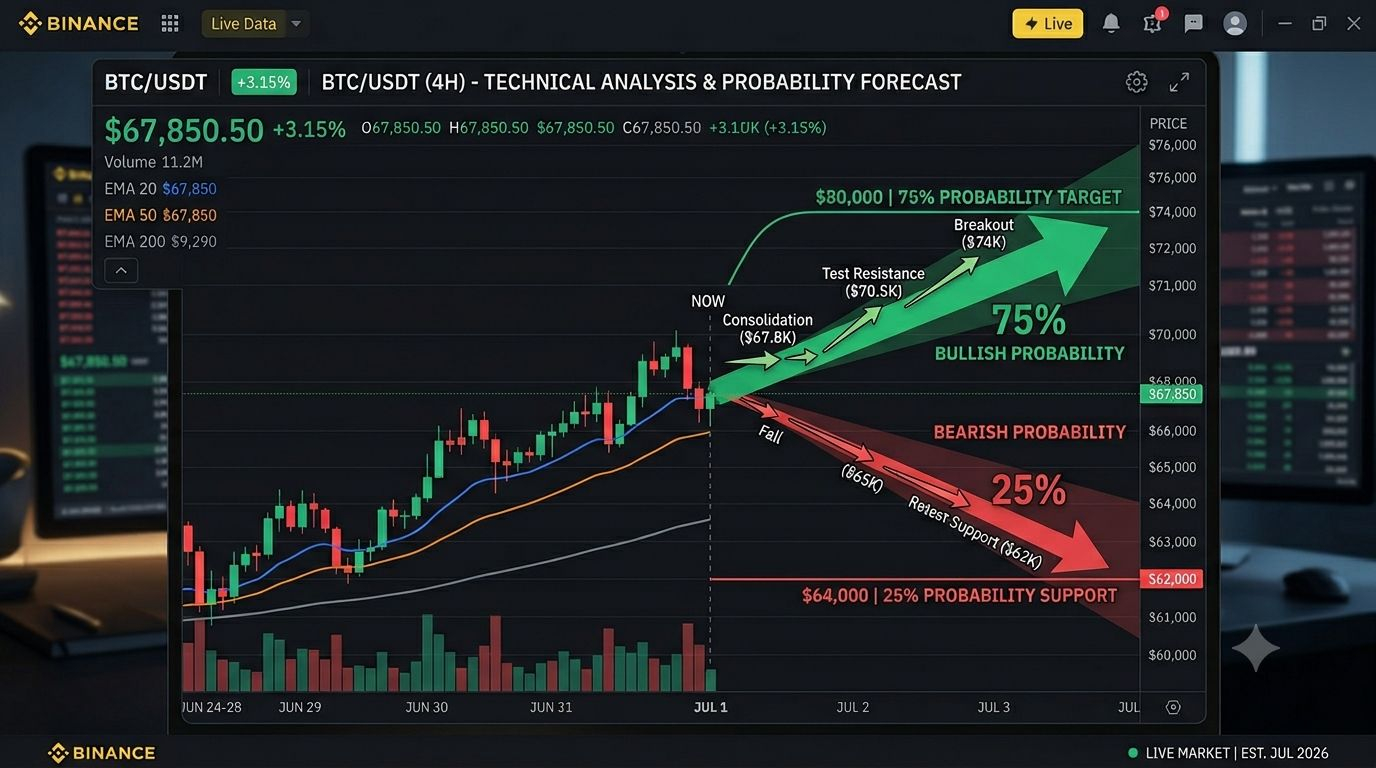
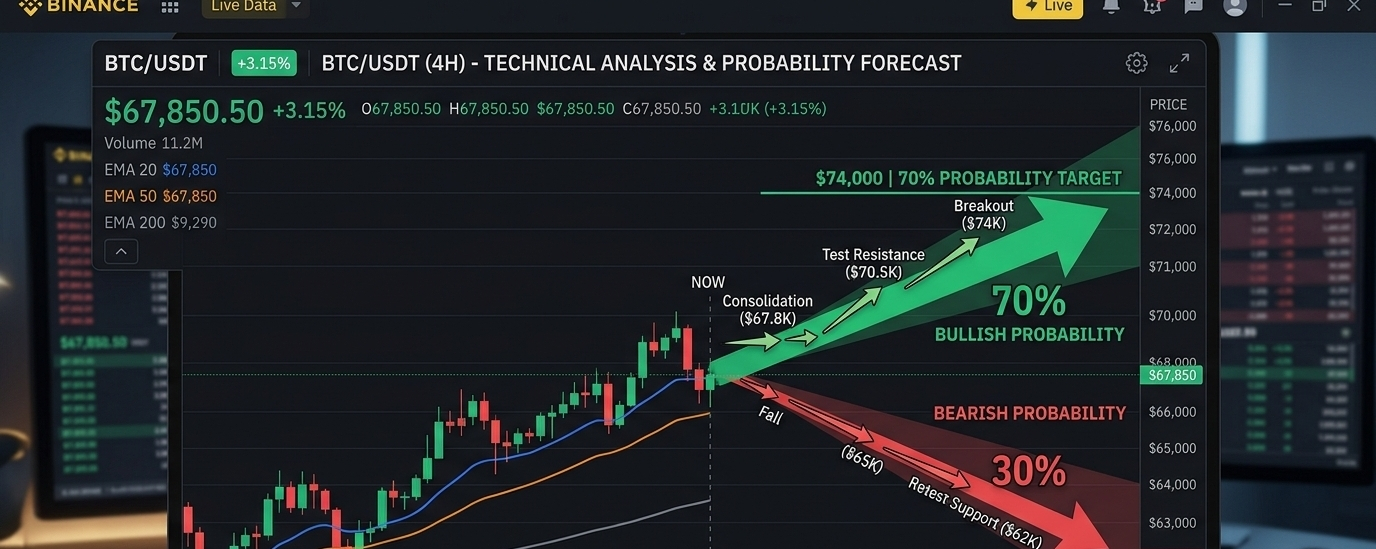
📈 Technical Chart Analysis & Probability
[ Resistance: $66,000 - $68,000 ] ⚡️ Target Zone
▲
│ ▲ (65% Bullish Probability)
│ ╱
─── $64,000 Consolidation Zone ────────────────────────
╲
▼ (35% Bearish Probability)
[ Support: $61,500 - $62,200 ]
The Bullish Scenario (65% Probability): $BTC is currently building a solid base. If buyers can successfully defend the $BTC 63,200 floor and push volume past the 21-day EMA resistance at $65,500, a swift squeeze up to the $66,000 – $68,000 zone becomes highly likely.
The Bearish Scenario (35% Probability): A failure to sustain momentum here could lead to a quick flush down to test structural support at $61,500 – $62,200 before the macro reversal triggers.
Keep your eyes locked on the order books on Binance—volume is starting to cluster around these key levels. Trade smart!
Tags:
#BTC #Binance #CryptoAnalysis #BitcoinSquare #CryptoNews