
The broader cryptocurrency market is showing relative strength today, with both Bitcoin (BTC) and Ethereum (ETH) trading in the green. This stability among the majors has helped improve sentiment across the altcoin space, and Zcash (ZEC) is now emerging as one of the tokens showing early signs of a momentum shift.
$ZEC has managed to post nearly 9% gains, and more importantly, the combination of rising whale accumulation and a well-defined technical structure on the daily chart suggests that an upside move could be forming beneath the surface.
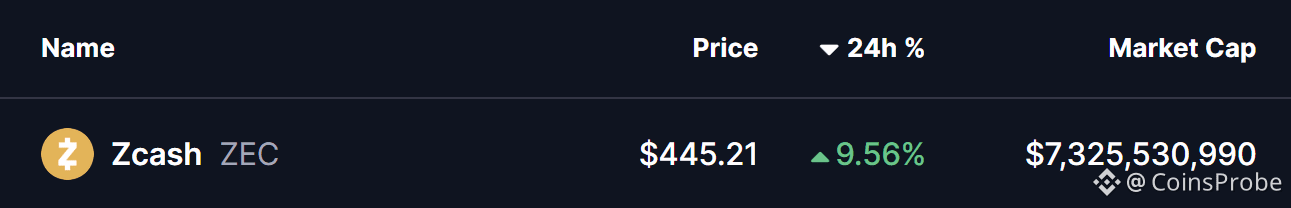 Source: Coinmarketcap
Major Whale Accumulation
On-chain data is beginning to support the bullish narrative. According to data shared by Lookonchain, a newly created wallet (t1XKfb) withdrew 30,000 ZEC worth approximately $13.25 million from Binance just nine hours ago. Large withdrawals of this nature typically reduce immediate selling pressure on exchanges and often signal long-term accumulation rather than short-term speculation.
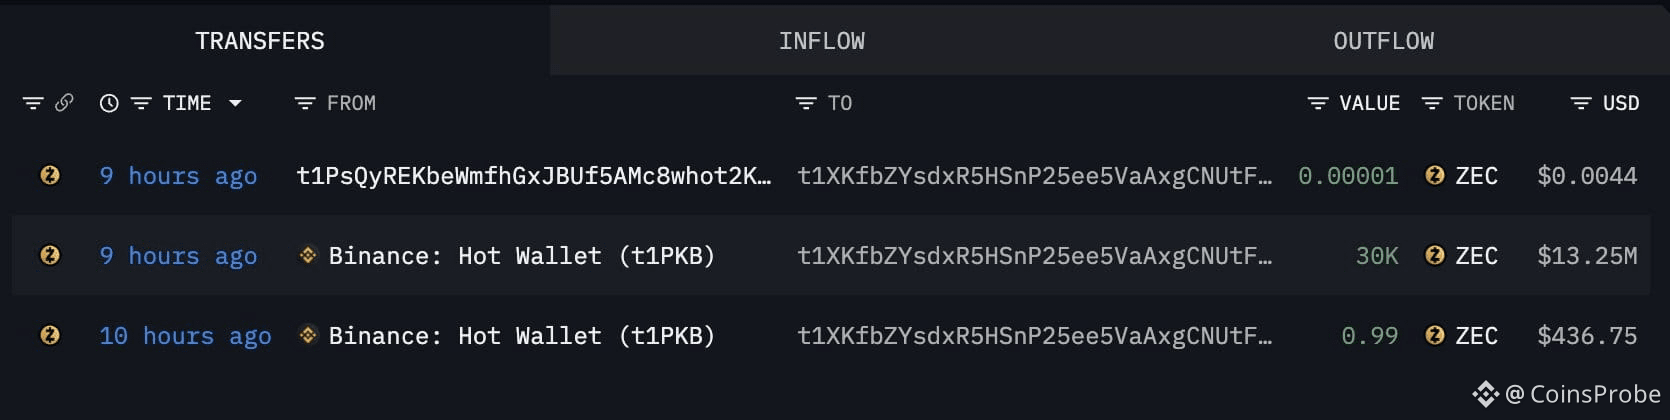 $ZEC Whale Accumulation//Source: @lookonchain (X)
This whale activity aligns closely with ZEC’s improving technical posture, reinforcing the idea that larger players may be positioning ahead of a potential breakout.
Ascending Triangle Structure Takes Shape
On the daily chart, Zcash is forming a textbook ascending triangle, defined by a sequence of higher lows pressing steadily against a horizontal resistance zone. This pattern is widely viewed as a bullish continuation setup, especially when accompanied by accumulation activity.
ZEC recently faced rejection near the neckline resistance around $457, which pushed price back toward its rising support trendline near $404. However, each pullback has been met with strong buying interest, keeping the structure intact and preventing any deeper breakdown.
The latest rebound has carried ZEC back toward the $444 area, highlighting renewed buyer strength and suggesting that sellers are struggling to regain control. This price behavior reflects healthy consolidation rather than weakness.
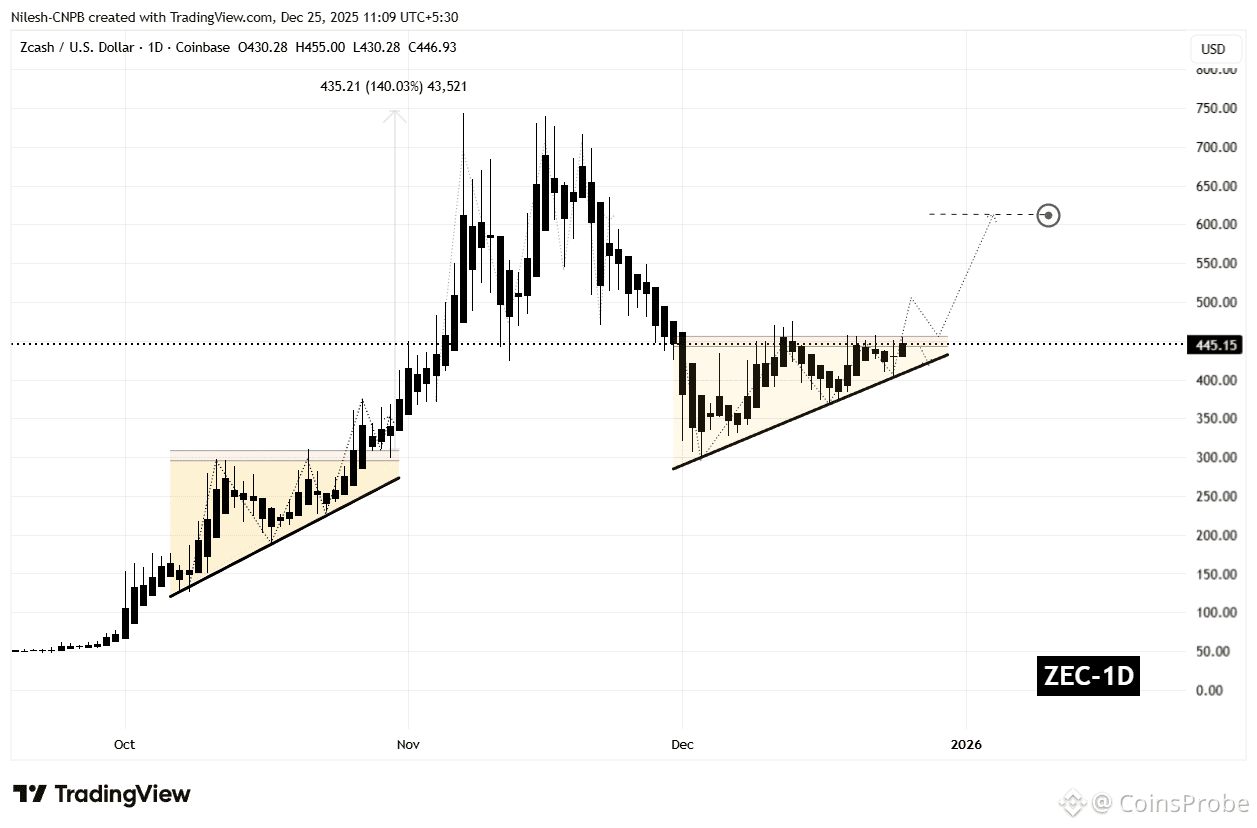 Zcash (ZEC) Daily Chart/Coinsprobe (Source: Tradingview)
Notably, a similar structure played out in October, when ZEC broke out of a comparable consolidation range and surged by an impressive 140%, underscoring the relevance of this pattern in Zcash’s recent price history.
What’s Next for ZEC?
From here, ZEC appears to be gearing up for another test of the neckline resistance between $441 and $457. A confirmed daily close above this zone, particularly if followed by a successful retest as support, would validate the breakout and could trigger a strong bullish expansion.
Based on the measured move of the ascending triangle, the technical upside projection points toward $613, representing a potential 37% upside from current levels. This target also aligns with prior price structure, adding further weight to the bullish scenario.
That said, traders should remain cautious. A failure to break above resistance could send ZEC back toward its rising support line, where the pattern would need to continue holding to preserve the bullish outlook.
For now, the combination of whale accumulation, improving market sentiment, and a tightening bullish structure suggests that Zcash is approaching a critical decision point — one that could define its next major move.
Disclaimer: The views and analysis presented in this article are for informational purposes only and reflect the author’s perspective, not financial advice. Technical patterns and indicators discussed are subject to market volatility and may or may not yield the anticipated results. Investors are advised to exercise caution, conduct independent research, and make decisions aligned with their individual risk tolerance.


