Trading is not just about buying low and selling high. It is a process of understanding how markets move, where liquidity sits, how large players operate, and what drives price behavior behind the scenes. Many beginners rely only on simple indicators or random signals, but professional traders use a multi-layered approach. This includes technical structure, liquidity zones, on-chain data, fundamental analysis, and market sentiment. Ignoring any of these elements can turn trading into gambling.
Understanding Liquidity and Liquidation Heatmaps
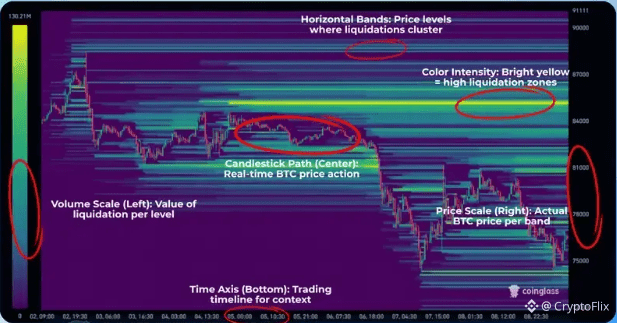
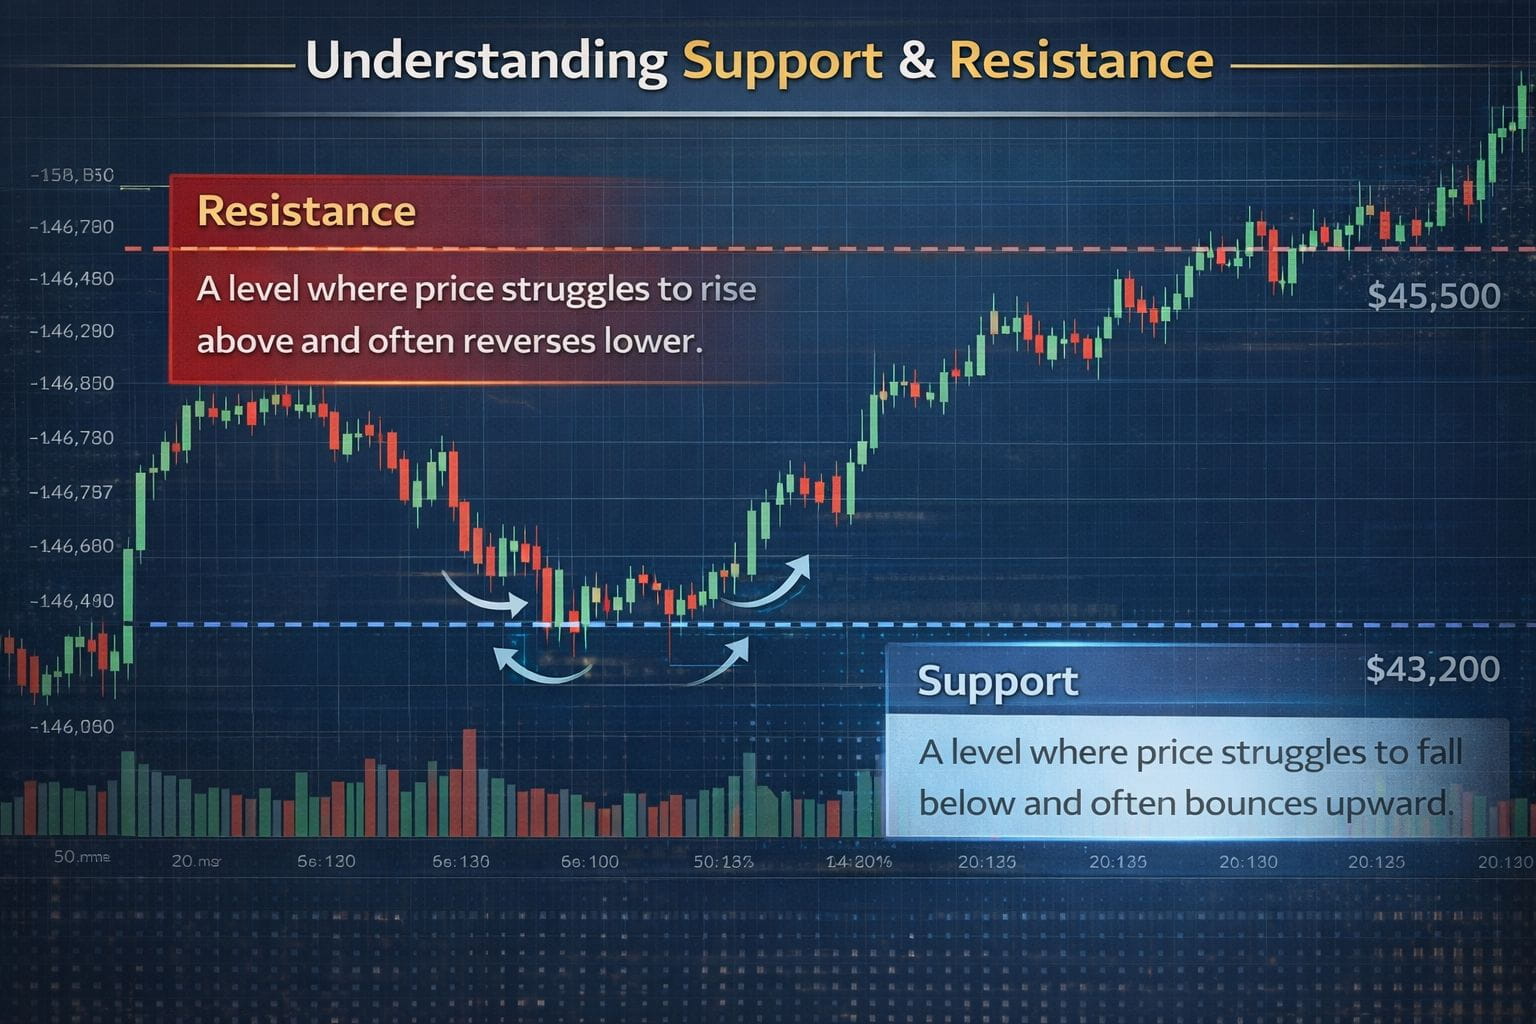
One of the most important concepts in modern trading is liquidity. Liquidity represents areas where a large number of stop losses and liquidation orders are placed. Liquidation heatmaps visually show these clusters. For example, on $BTC, you often see heavy liquidation zones above resistance and below support. These zones act like magnets for price because large players aim to push the market toward these levels to trigger forced liquidations.
Instead of chasing price, smart traders wait for price to move into these liquidity zones. This helps avoid emotional entries and reduces the chances of getting trapped. Knowing where liquidity sits gives traders an edge because markets are designed to hunt liquidity, not reward impatience.
Reading Chart Patterns with Context
Chart patterns reflect crowd psychology. Patterns like triangles, wedges, flags, double tops, and head and shoulders are visual representations of indecision, exhaustion, or accumulation. For example, when $BTC forms a tight range after a strong move, it often signals compression before a breakout.
However, patterns should never be used alone. A pattern only becomes powerful when it aligns with support and resistance, volume behavior, and liquidity zones. Many false breakouts happen because traders rely on patterns without considering the bigger picture.
Order Blocks and Fair Value Gaps
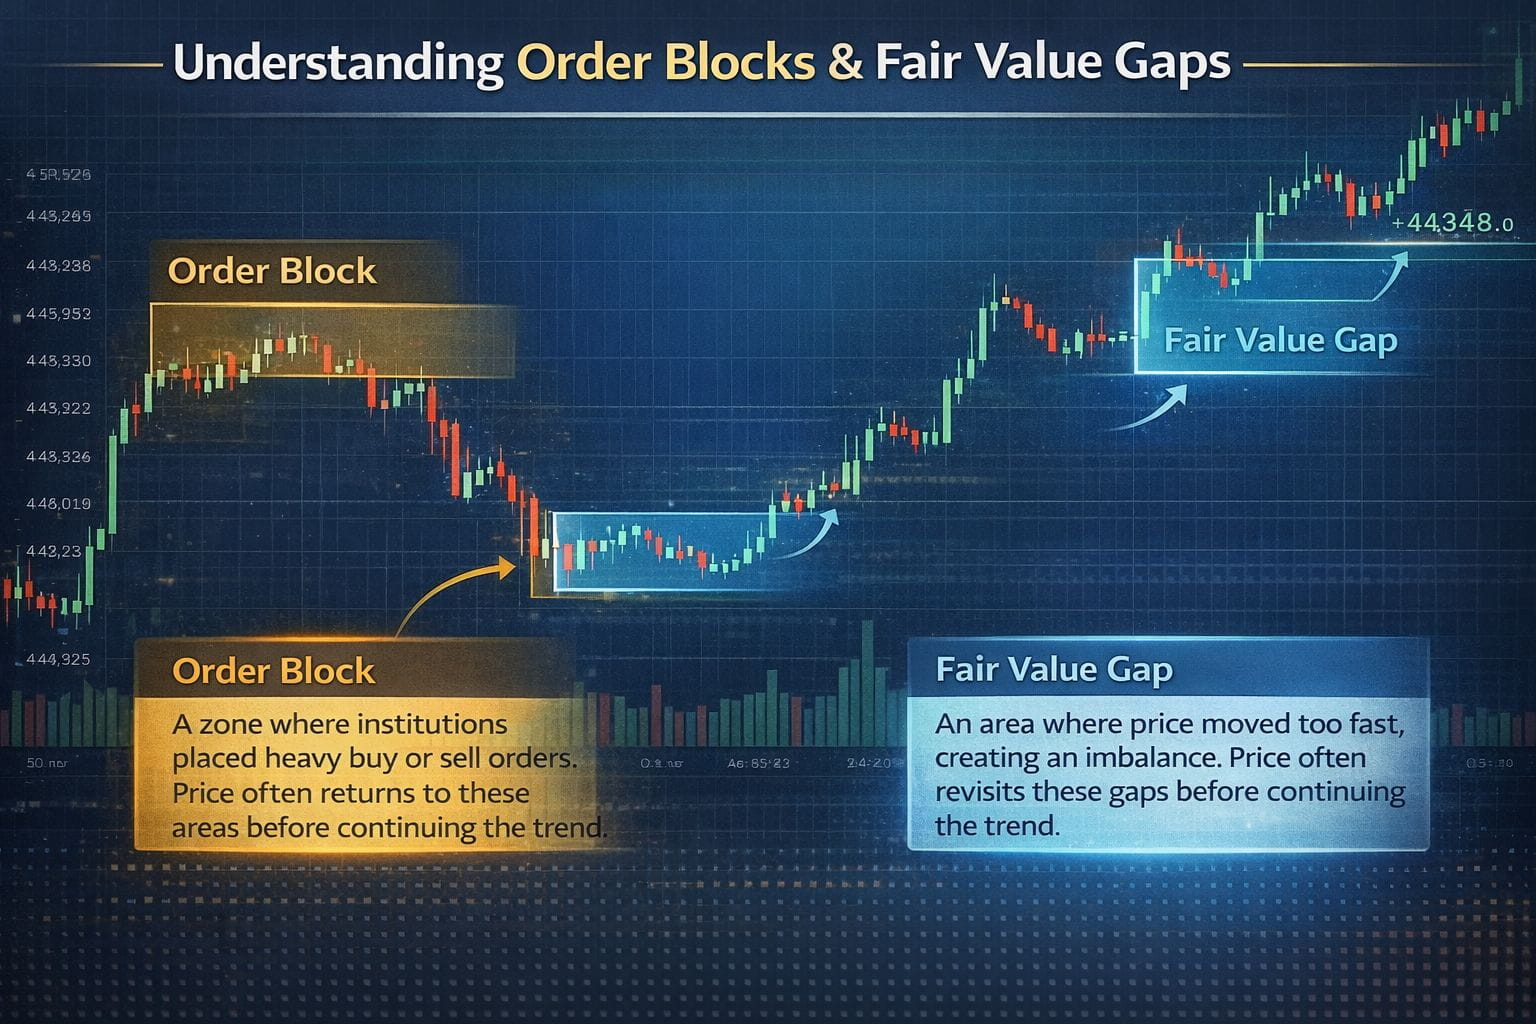
Order blocks are areas where institutions and large players placed heavy buy or sell orders in the past. These zones often act as strong support or resistance when price revisits them. Retail traders usually ignore these zones, but institutions use them as re-entry areas.
Fair value gaps represent inefficiencies in price movement. When price moves too quickly, it leaves behind an imbalance. Markets often return to these zones to rebalance before continuing their trend. On assets like $BTC, these zones frequently act as high-probability reaction areas. Combining order blocks and fair value gaps helps traders avoid random entries and focus on structured setups.
The Importance of On-Chain Data
On-chain data reveals what is happening behind the chart. It shows how coins move, where they are stored, and how holders behave. Metrics like exchange inflows and outflows, whale wallet movements, long-term holder activity, and network usage provide insight into real demand and supply.
For example, when large amounts of $BTC move from exchanges into cold wallets, it often signals accumulation. When coins move back to exchanges, it may indicate potential selling pressure. On-chain data helps traders understand whether a move is supported by real activity or just speculation.
Fundamental Analysis: Supply, Liquidity, and Unlocks
For altcoins especially, fundamentals matter a lot. Traders should always check total supply, max supply, circulating supply, and upcoming token unlocks. A project might look bullish on the chart, but if a massive unlock is coming, price can face strong selling pressure.
Liquidity is another key factor. Low-liquidity tokens can pump fast, but they can also dump just as quickly. High-liquidity assets like $BTC are more stable and harder to manipulate. Understanding these factors helps traders avoid being caught in artificial pumps.
Market Sentiment and Crowd Psychology
Market sentiment is the emotional state of the crowd. It tells you whether traders are fearful, greedy, uncertain, or overly confident. Extreme fear often marks bottoms, while extreme greed usually forms tops.
Sentiment can be measured through funding rates, open interest, social media behavior, and news narratives. For example, when everyone on social media is calling for BTC to go to the moon, it often means most people are already in the trade. Smart traders usually look for opportunities when sentiment is quiet or negative, not when hype is at its peak.
The Power of Confluence
Confluence means multiple signals pointing to the same conclusion. A setup becomes stronger when liquidity zones, order blocks, chart structure, on-chain data, fundamentals, and sentiment align.
For example, if BTC is sitting at a strong order block, there is a liquidation cluster above, on-chain data shows accumulation, and sentiment is fearful, that setup carries much higher probability. One signal alone is never enough. Professionals wait for alignment.
Risk Management and Probabilities
Trading is not about being right every time. It is about managing risk and stacking probabilities in your favor. Even the best setups can fail. That is why position sizing, stop losses, and risk-to-reward ratios are crucial.
A trader who controls risk can survive bad trades. A trader who ignores risk will eventually lose everything, even after a few winning trades.
Final Thoughts
Successful trading is a combination of analysis, patience, and discipline. Understanding liquidity, structure, on-chain data, fundamentals, and sentiment gives traders a massive advantage. Instead of reacting emotionally, professional traders wait for price to come to them.
Markets are designed to test patience, punish impulsiveness, and reward preparation. The more you understand how the system works, the less you depend on luck.
#CryptoTradingInsights #CryptoTradingTip
