Hey Binance Square, as a crypto analyst who's seen a few cycles, I'm always cautious about calling bottoms. But with BTC dipping below $80,000 recently—hitting as low as $78,719.63 amid concerns over tighter liquidity from the new Fed chair pick, Kevin Warsh—it's worth looking at the mechanics of a potential rebound.

This drop isn't just a crypto quirk; macro liquidity expectations are dictating the pace for all risk assets. When the market braces for less easy money from the Fed, it hits everything from stocks to BTC hard. It's a classic case where global financial tides pull the strings, not isolated news.
The core idea here? A true BTC "rebound" isn't some magic green candle—it's a shift across three timelines:
Deleveraging clock (hours to days): Where forced selling from overleveraged positions finally exhausts itself.
Liquidity clock (days to weeks): When USD strength and bond yields quit squeezing risk appetite.
Confidence clock (weeks to months): Buyers start holding through pumps instead of using them as exit doors.
We can't pinpoint the exact hour, but tracking these shifts helps spot when the market moves from panic dumps to genuine accumulation.
Now, here's my 7-signal checklist to gauge if we're nearing that regime change. These are data-driven markers I've used in past corrections—save this for your dashboard.
Signal A: Liquidations cool down (cascade ends)
When liqs spike, it's like shaking out the weak hands. We saw ~$1.68B wiped in 24 hours recently, with $780M in BTC longs getting rekt. But as of now, 24h liqs are at $0, suggesting the flush might be over.
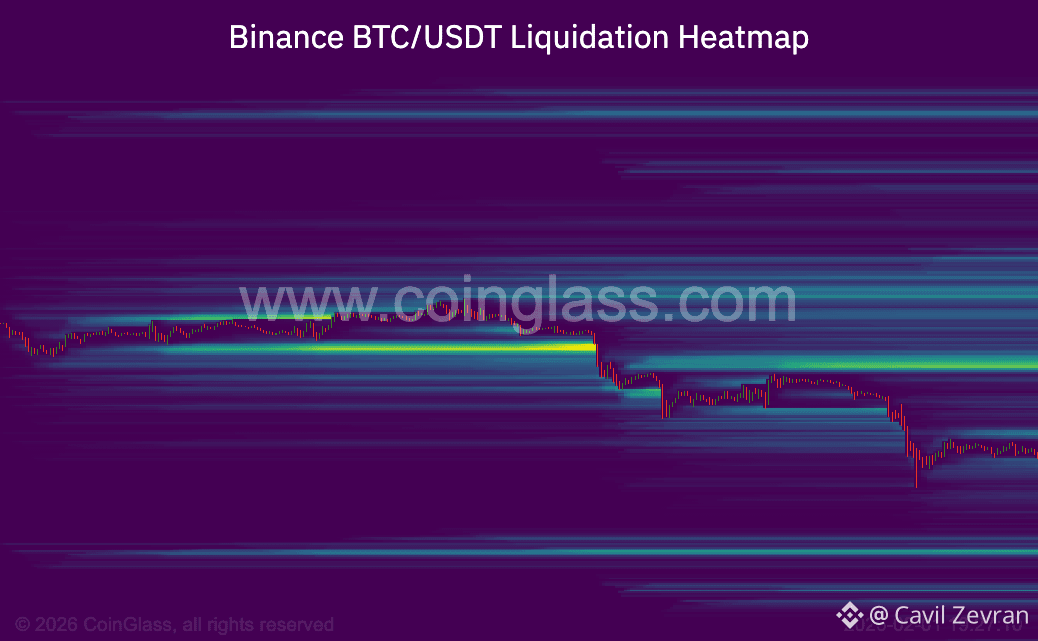
If totals stay low and don't flare on minor dips, it means leverage is cleared out—prime for a bounce.
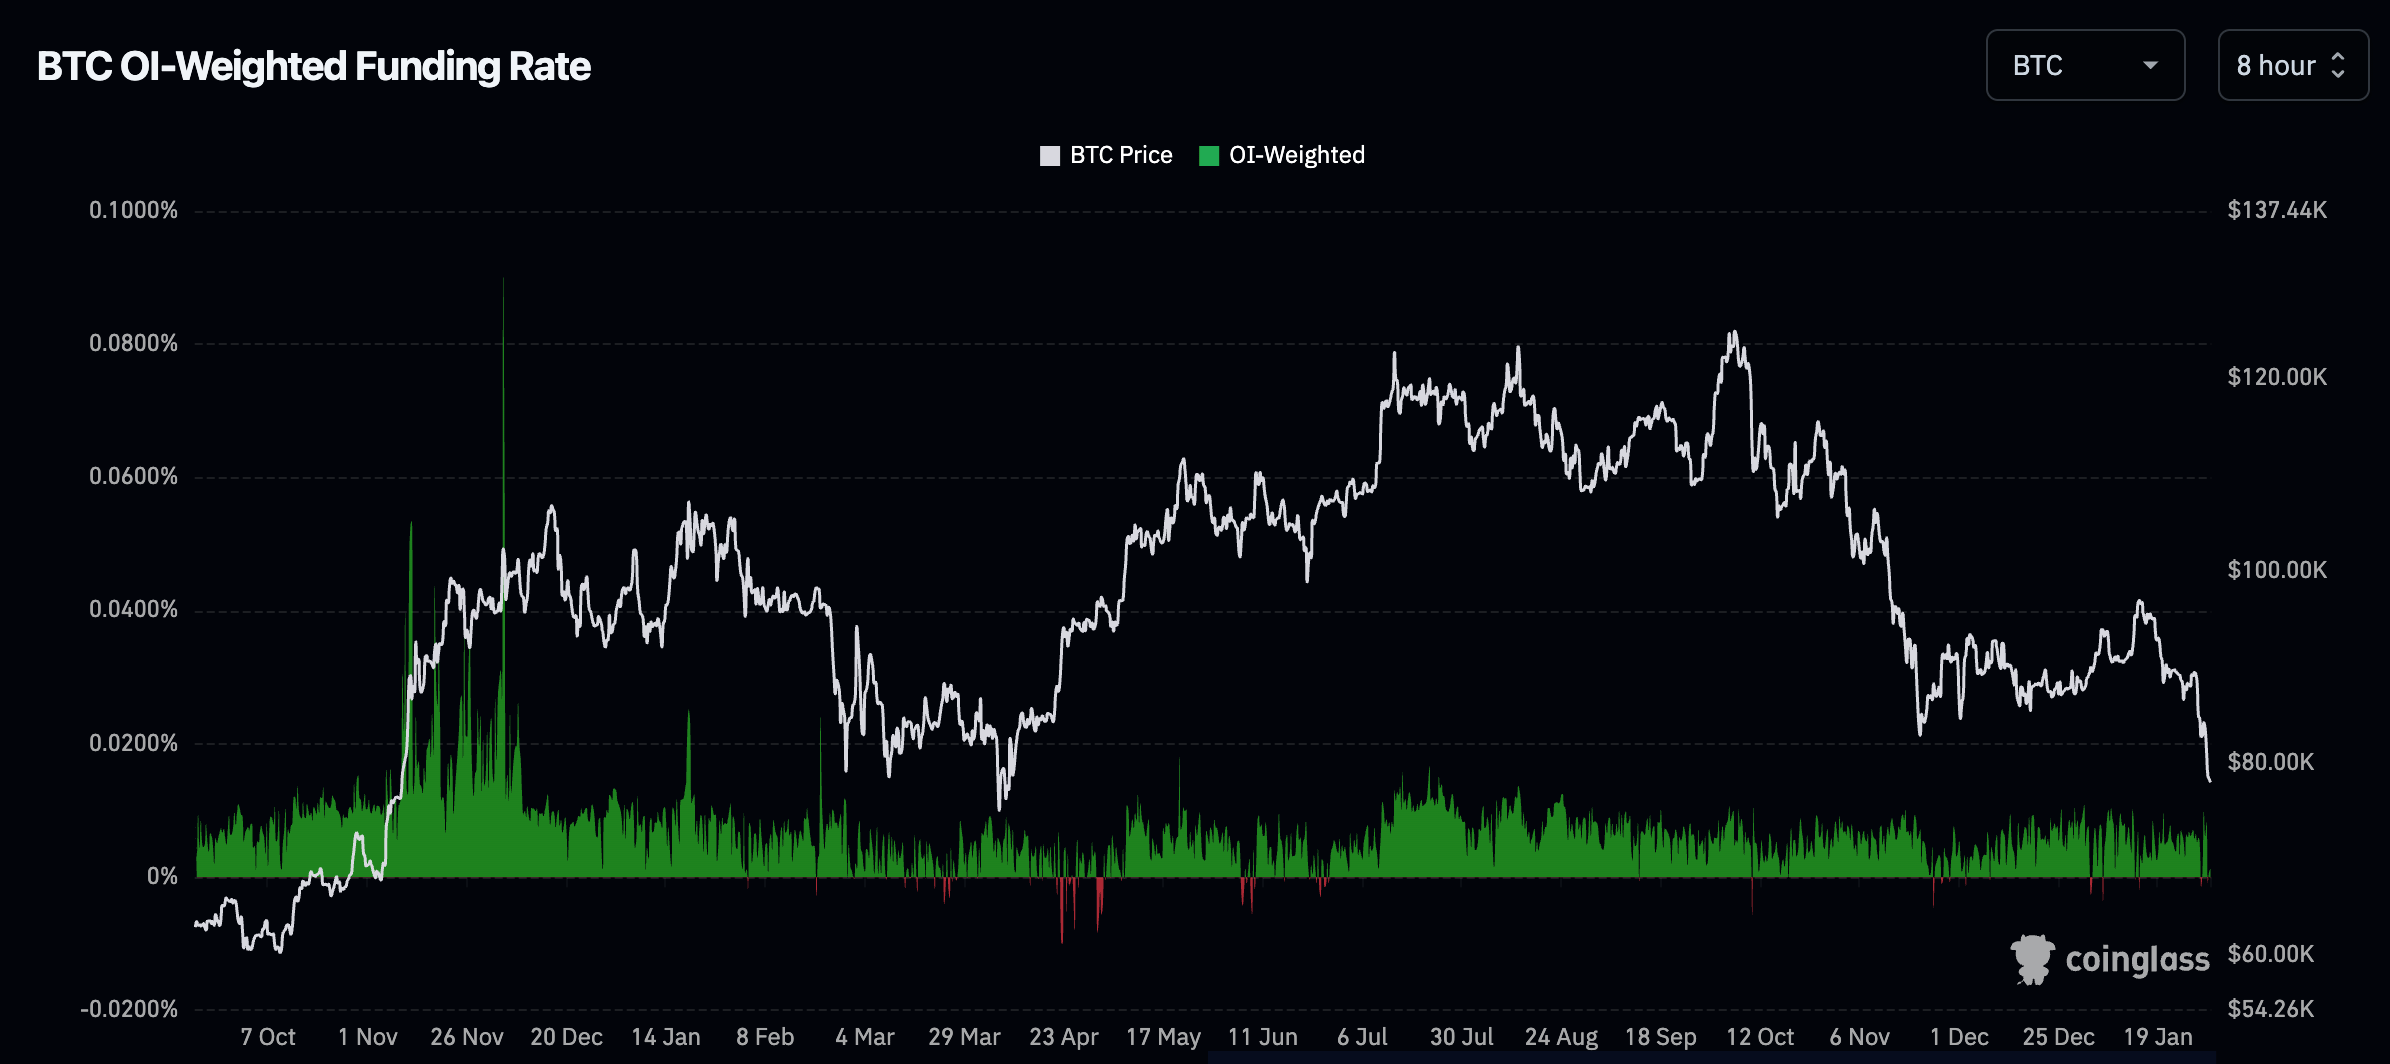
Signal B: Funding stops being “one-way”
Persistent skew in funding rates (like crowded longs or panic shorts) keeps the volatility treadmill running.
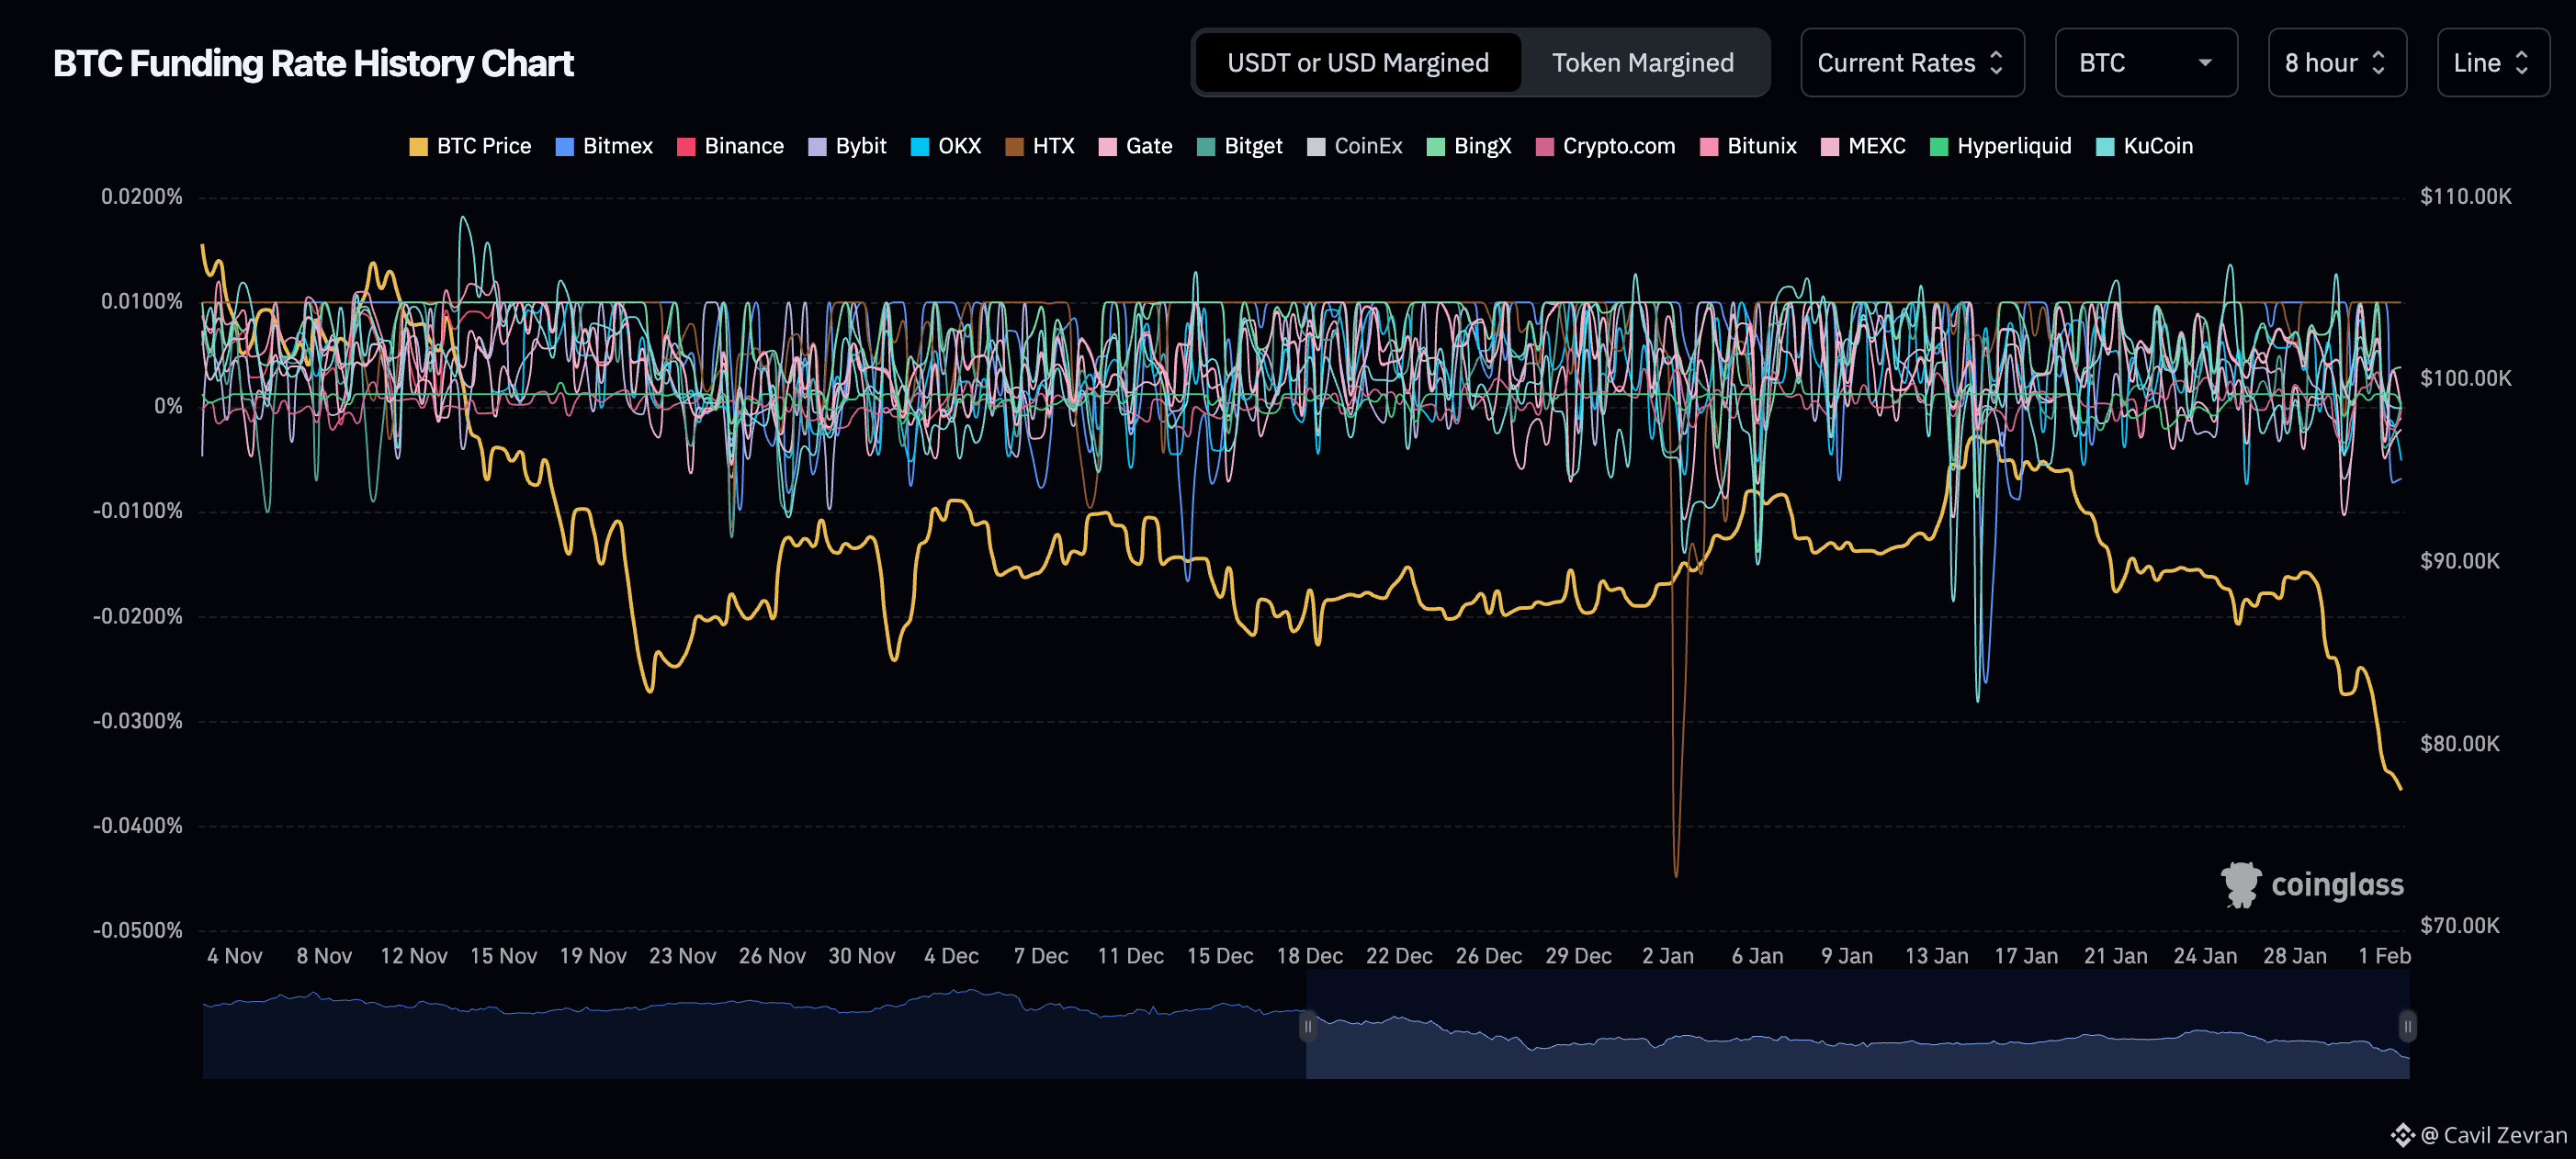
One green candle isn’t a rebound. Funding turning neutral is what reduces ‘liquidation treadmill’ risk and lets the market breathe.
Signal C: Open interest (OI) rebuilds without price dumping
OI dropping sharply like the recent 9.91% to $111B signals deleveraging. But watch for it to climb steadily with stable prices—that's healthy participation returning.
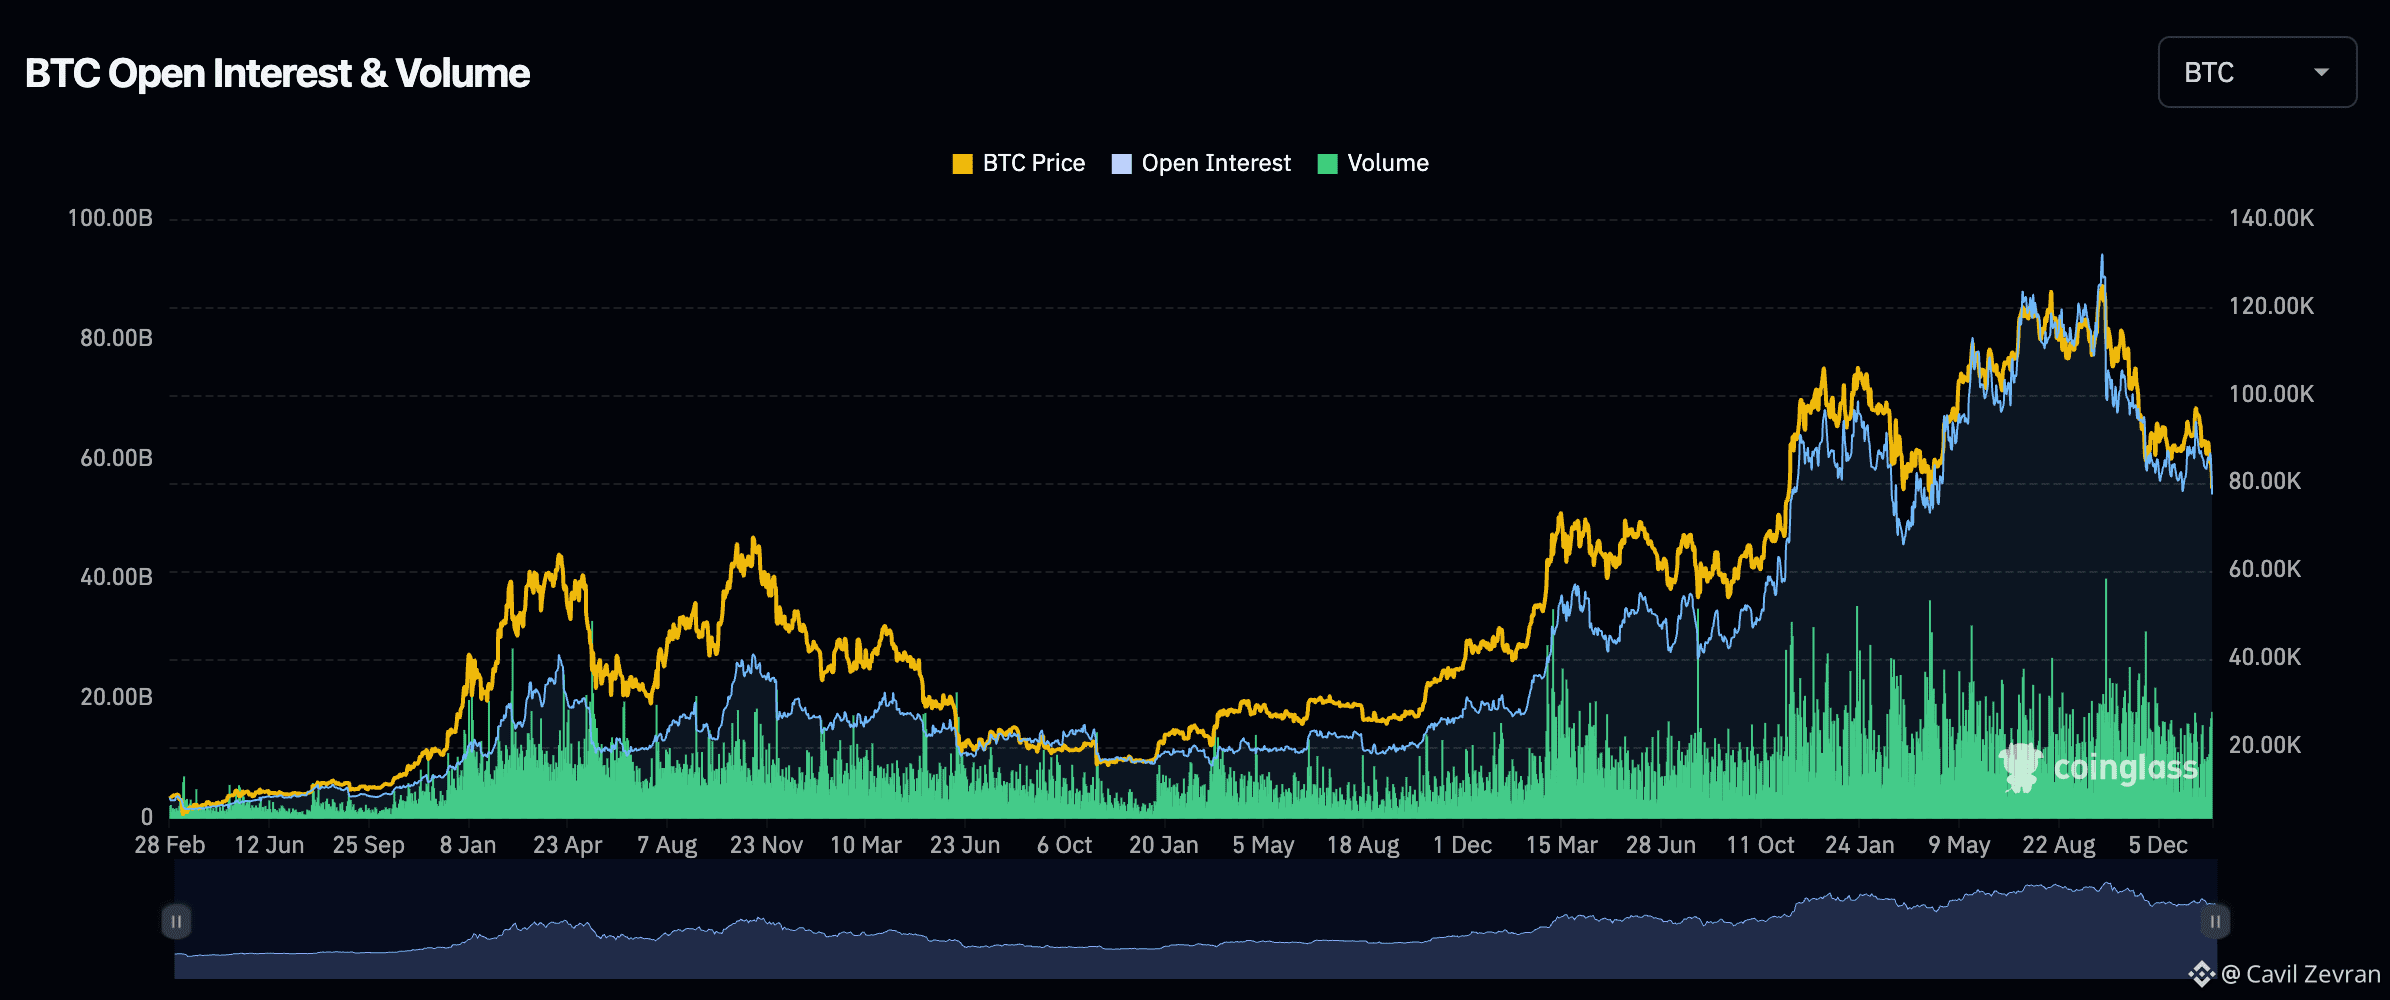
Good OI rebuild = participation returning. Bad OI rebuild = leverage back before the market is ready.
Signal D: Basis/Perps stop trading stressed
When perps trade at big premiums or discounts, it's panic mode.
When basis normalizes, the market is paying less ‘panic premium’ to hold exposure.
Signal E: Volatility stops repricing higher
Implied vol climbing means uncertainty is still priced in. Current DVOL at 46.70 with no recent change.
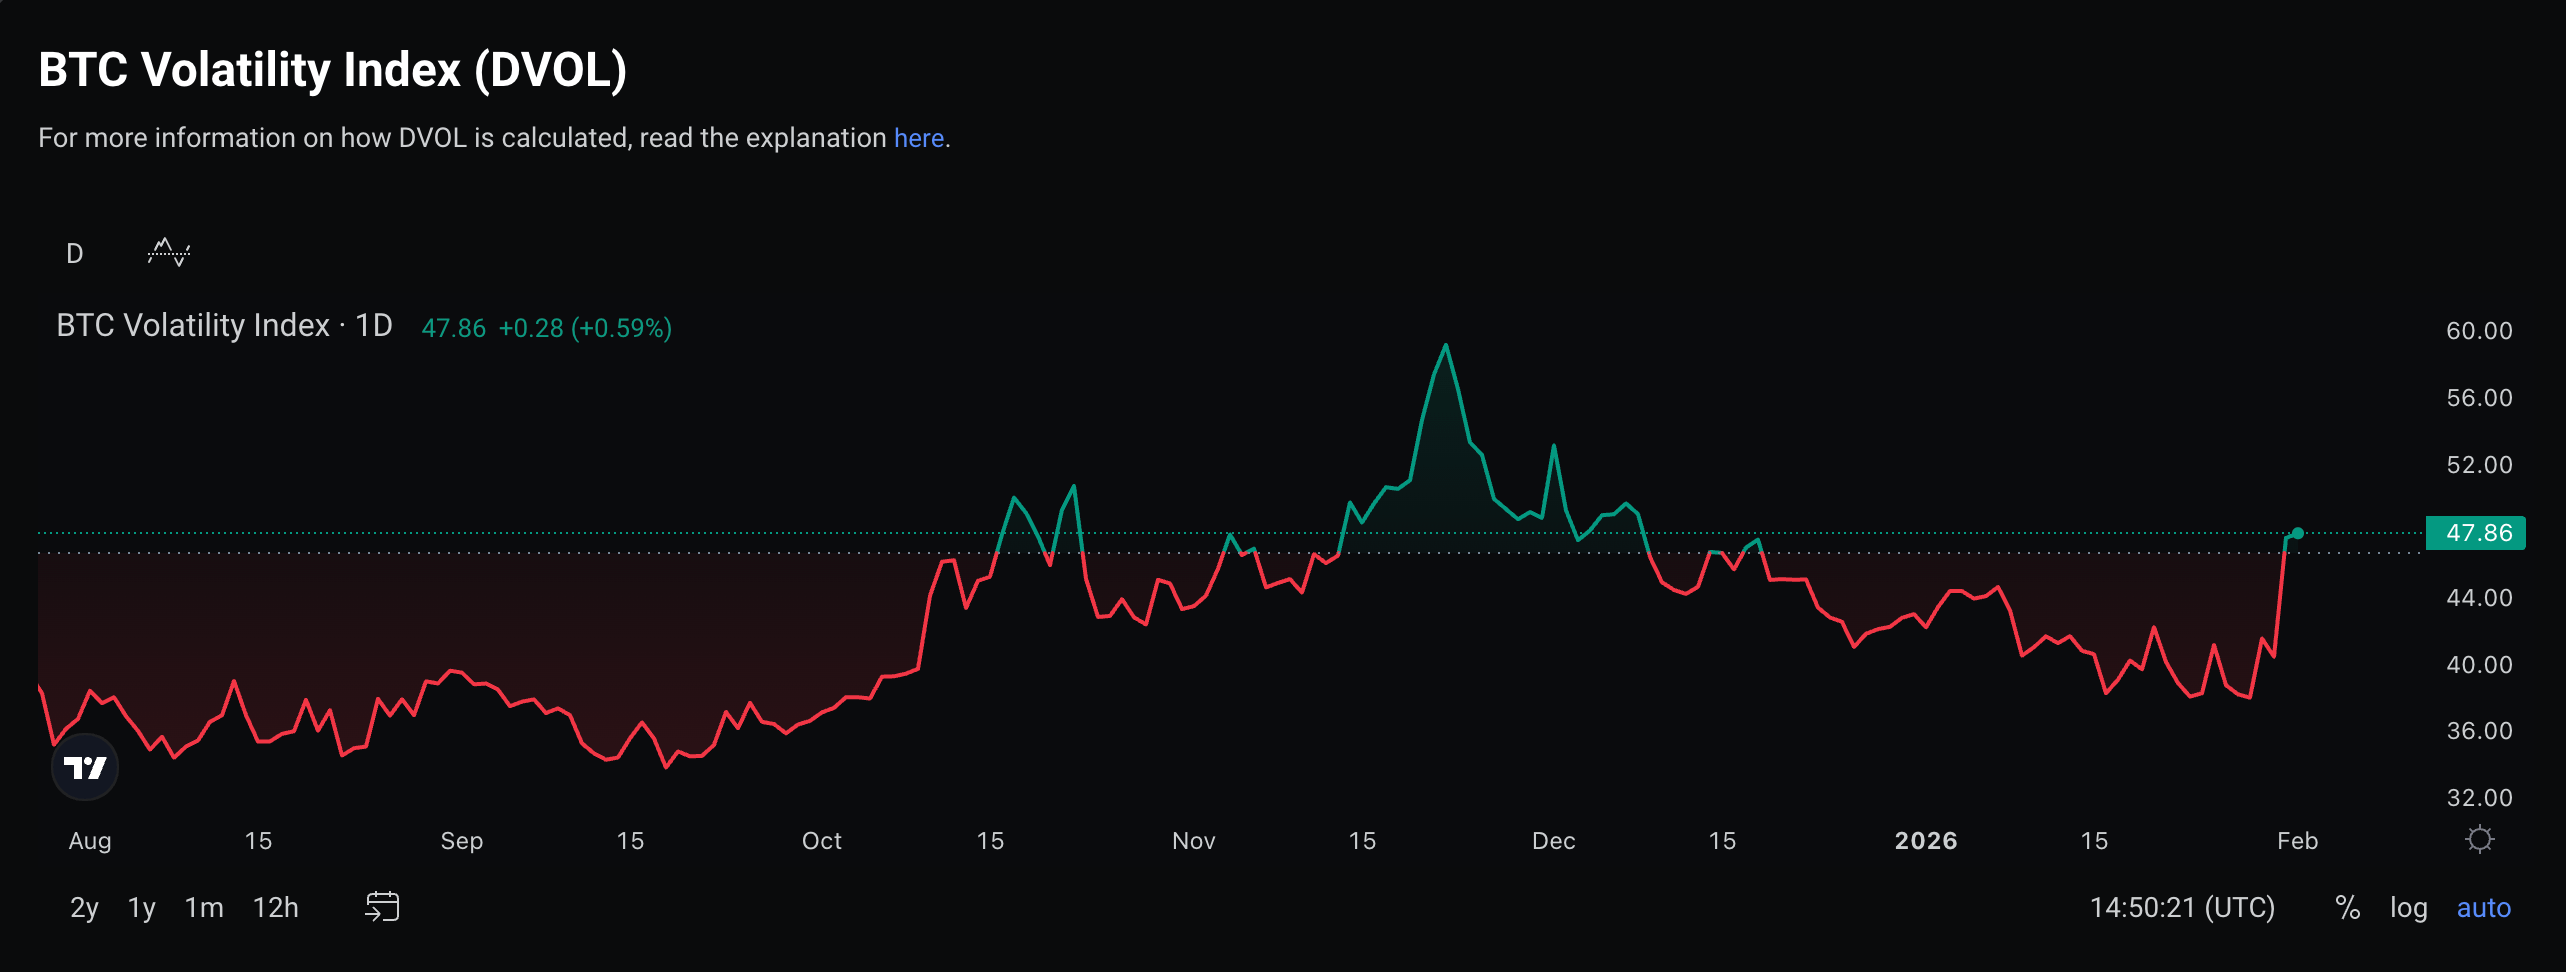
Rebounds become tradable when volatility stops expanding and ranges begin to compress.
Signal F: ETF flows stop bleeding
Those spot BTC ETFs influence sentiment big time. We had over $1.128B net outflows in just three days earlier this month.
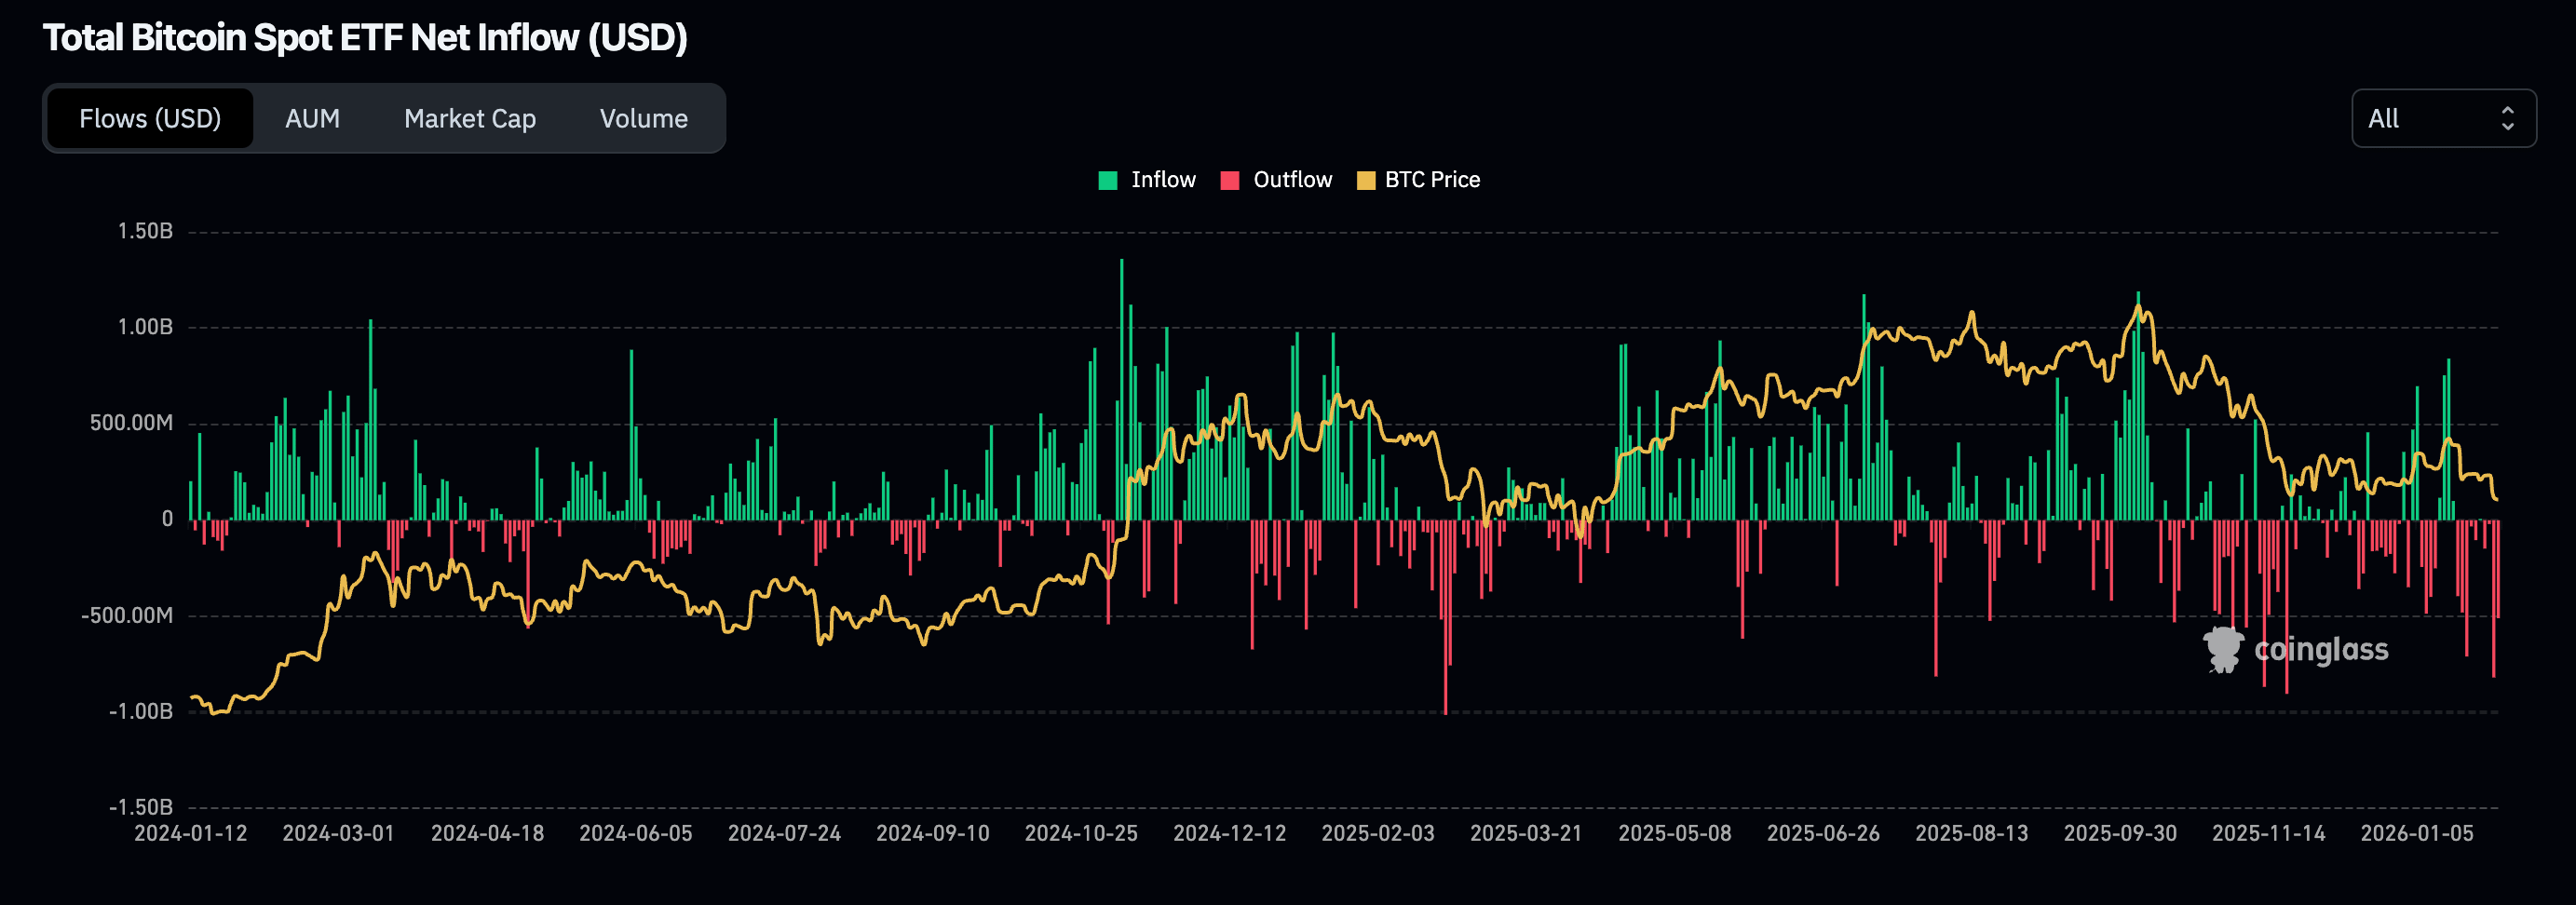
Flows don’t ‘cause’ price alone, but they shape the narrative and marginal demand.
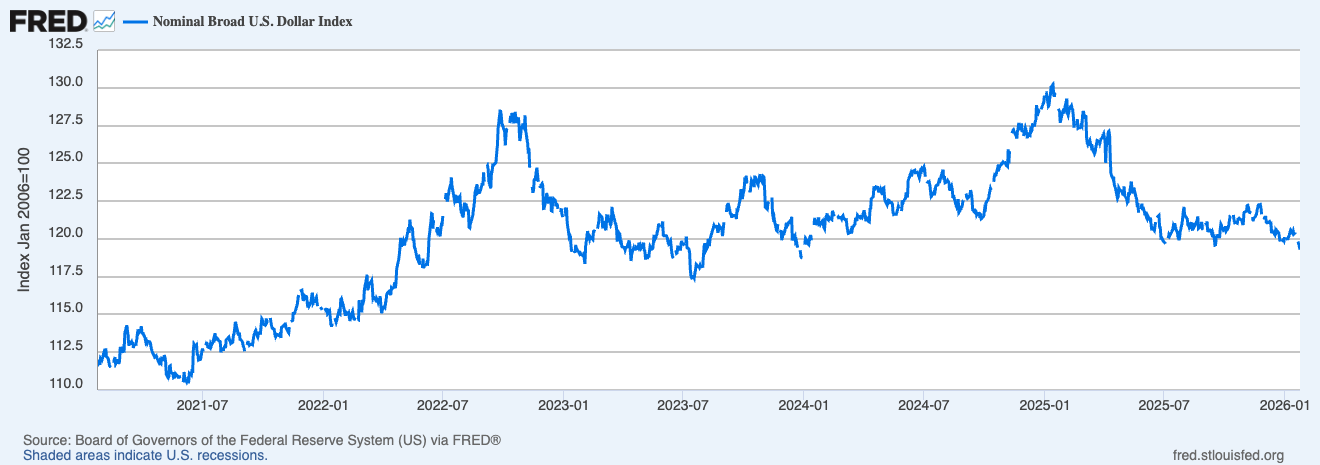
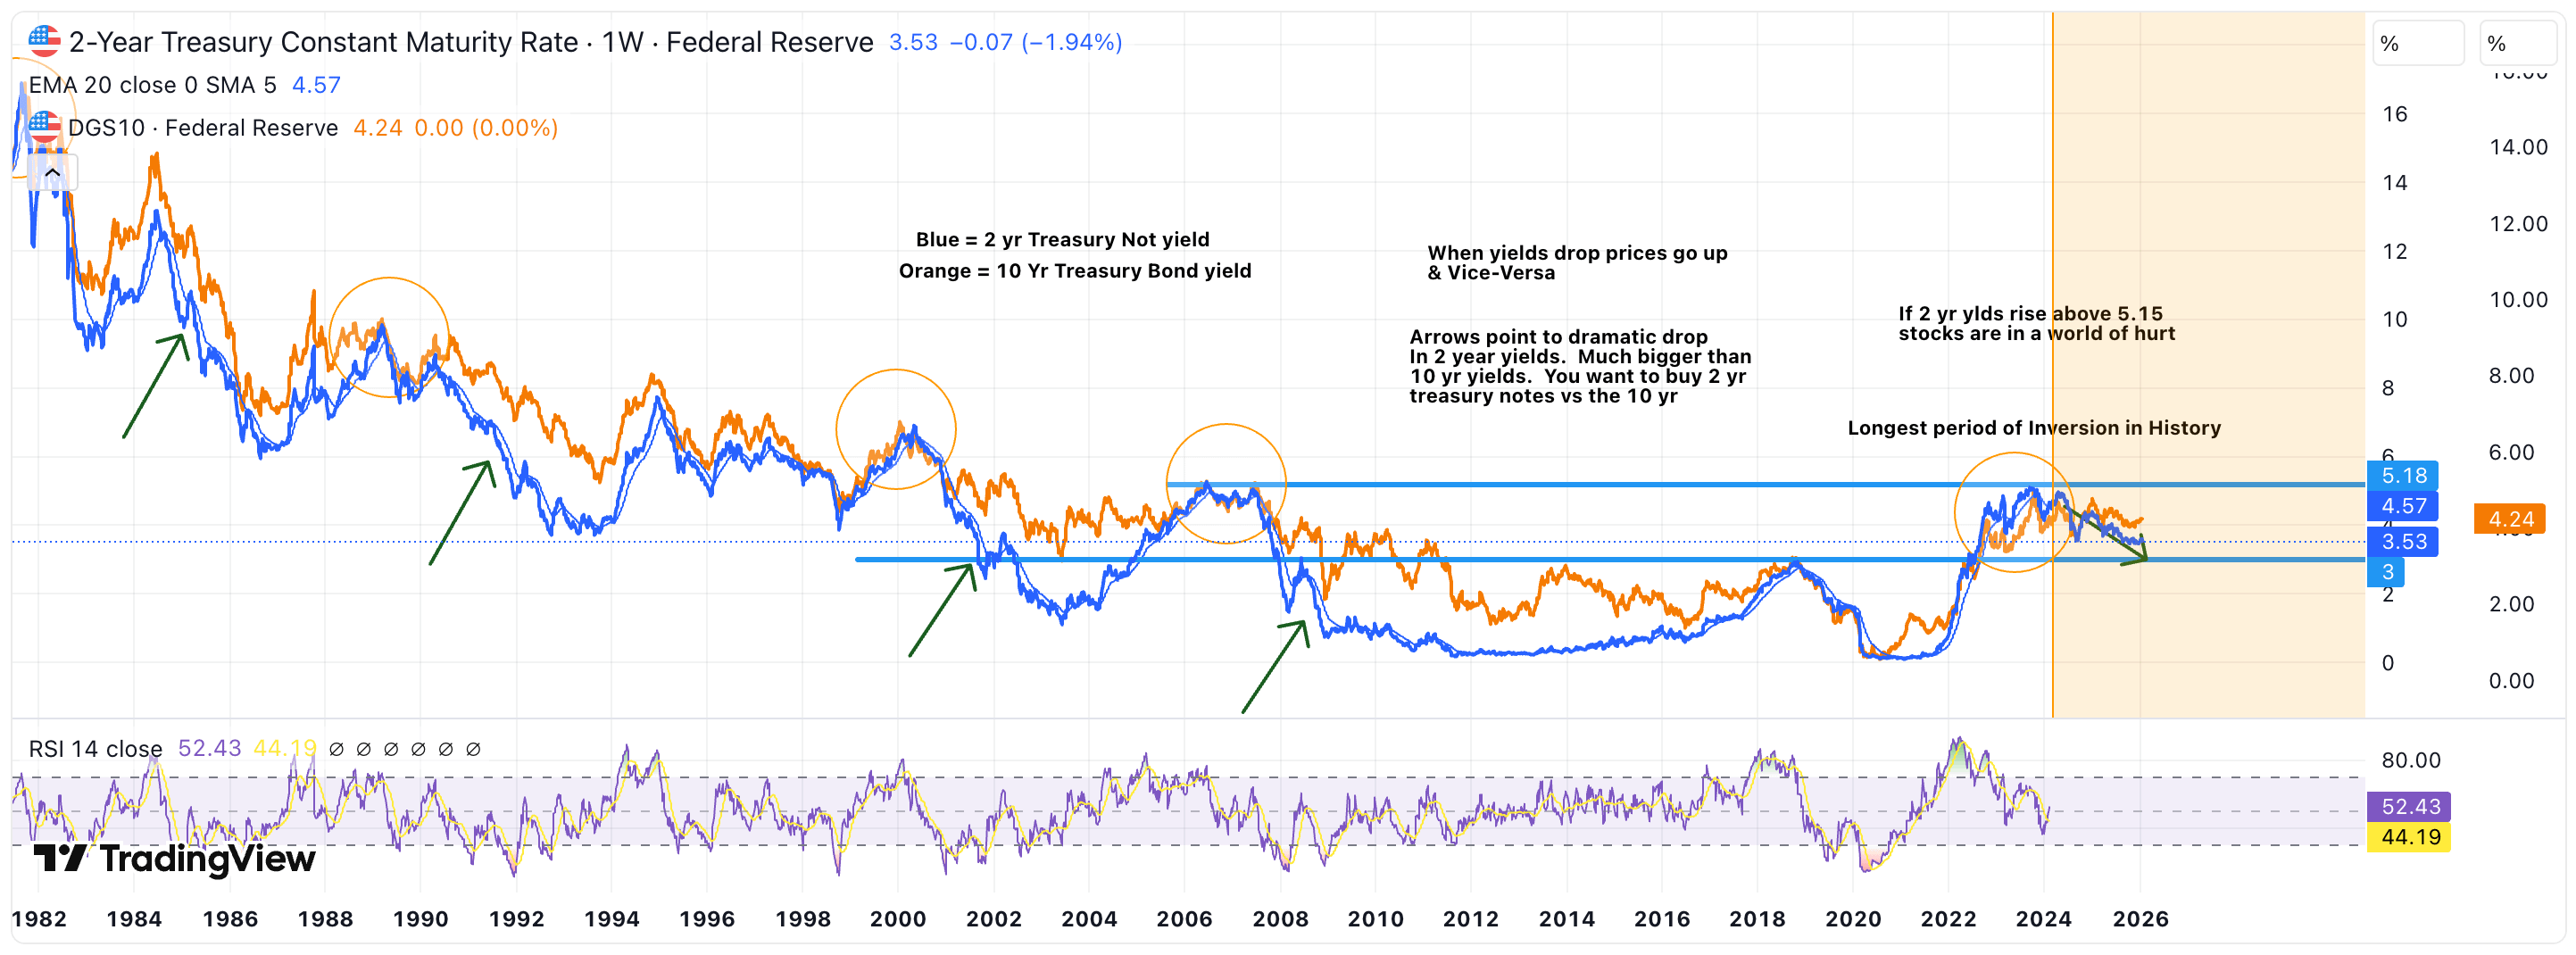
Signal G: Macro pressure eases (yields + USD)
Crypto hates when short-term yields and the dollar grind higher together. 2Y yields are stable around 3.53-3.60 lately, and the broad USD index is weakening to ~119.
Use this to avoid traps—no crystal ball needed:
Scenario 1: Dead-cat bounce – Liqs cool, but OI spikes with leverage; funding overheats quick; vol stays elevated.
Scenario 2: Base-building rebound – Liqs normalize, funding neutral, OI steady, vol compresses, macro eases.
Scenario 3: Continuation down – Macro tightens more, and bounces trigger new liq spikes.
This is not a price call—just conditions that usually separate real rebounds from traps.
Which signal do you trust most: liquidations, funding, OI, ETF flows, or macro? Drop your take in the comments! 🚀