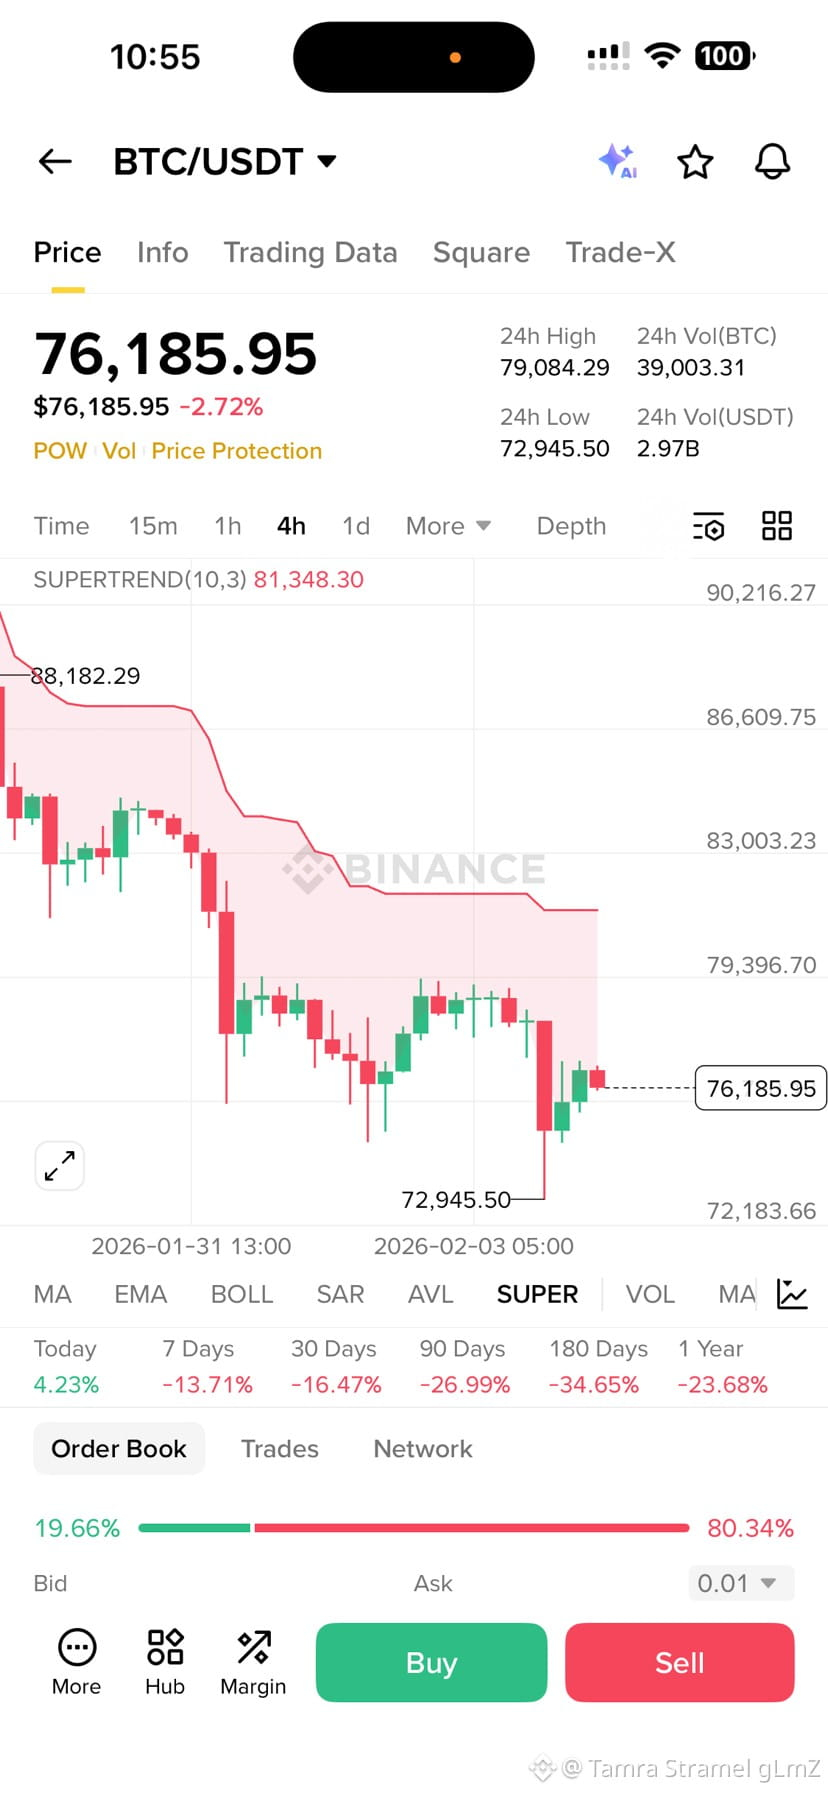
Bitcoin is currently trading around $76,000, after a sharp corrective move from the highs near $88K. To the untrained eye, this looks scary. To smart money, this looks like a textbook reset before continuation.
Let’s decode the chart.
1️⃣ The Capitulation Wick at $72,945 — The Bottom Signal
The most important candle on this chart is the long downside wick that tapped ~$72,945.
This is not random.
That candle tells us three critical things:
Sellers pushed price aggressively lower
Buyers absorbed everything instantly
Price closed far above the low
That is called sell-side exhaustion.
👉 Weak hands panic-sold
👉 Strong hands stepped in
👉 Liquidity was collected
Markets do NOT bottom quietly.
They bottom with fear, speed, and violence — exactly what this wick shows.
2️⃣ Higher Low Structure Is Already Formed
After touching $72.9K, Bitcoin did NOT make a lower low.
Instead:
Price bounced
Pulled back
Held above the previous low
This confirms a higher low on the 4H timeframe.
📌 Higher low after a strong rejection = trend preservation
If bears were in control, price would already be below $72K.
They failed. That failure is bullish.
3️⃣ Supertrend Resistance = Temporary, Not Trend Reversal
Yes, price is currently below the 4H Supertrend (~$81,300).
But context matters.
During strong bull markets:
Supertrend flips red during pullbacks
Price consolidates underneath
Then explodes back above, triggering trend continuation
What’s important is this:
👉 Supertrend is flattening
👉 Price compression is occurring
👉 Volatility is contracting
This is the coil before expansion.
Once BTC reclaims $81K–$82K, Supertrend flips green and momentum traders pile in.
4️⃣ Volume Profile Confirms Accumulation
Look at the price behavior between $74K–$78K:
Tight candles
No panic continuation
Buyers stepping in on every dip
This is not distribution.
This is absorption.
Smart money doesn’t chase green candles.
They build positions when retail is scared.
And retail sentiment right now?
Fearful, confused, impatient.
Perfect.
5️⃣ Why $86K Is the Natural Target (Not a Dream)
Now the fun part.
🔹 Previous High Liquidity Zone
The $85K–$88K region is:
Prior rejection zone
Unfilled liquidity area
Magnet for price once momentum returns
Markets love to revisit unfinished business.
🔹 Measured Move Logic
From:
$72.9K bottom
To $81K resistance
A clean breakout projects $85K–$86K as the first expansion target.
This is not prediction.
This is math + structure.
6️⃣ Why This Is a Bear Trap
Let’s be very clear:
Bears failed to break structure
Bears failed to follow through after the dump
Bears are now selling into support
That is the definition of a bear trap.
When BTC flips $81K:
Shorts get squeezed
Late sellers chase back in
Momentum ignites
And price moves fast. Very fast.
7️⃣ The Psychology Check
Everyone who bought late:
Is nervous
Wants out on the next bounce
That bounce becomes the fuel.
Bitcoin doesn’t move up when everyone is confident.
It moves up when doubt is high and positioning is wrong.
That’s exactly where we are.
🔥 Final Verdict
✔ Strong capitulation wick at $72.9K
✔ Higher low confirmed
✔ Accumulation zone holding
✔ Supertrend about to flip
✔ Liquidity resting at $86K
This is not the start of a bear market.
This is:
The bottom of the correction before the next leg up.
🎯 Target: $85K–$86K
⏳ Timing: After $81K reclaim
🧠 Bias: Aggressively bullish