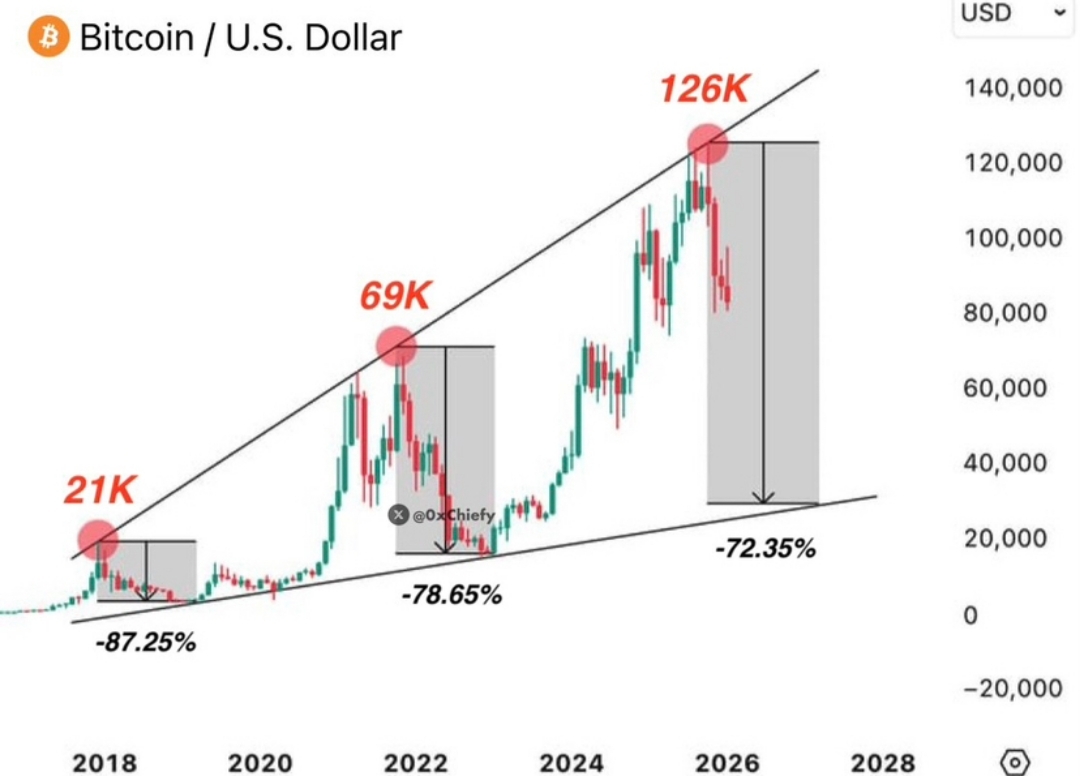
 Questo grafico mostra chiaramente il modello storico di Bitcoin:
• Massimo del 2018 → Calo: -87.25%
• Massimo del 2021 → Calo: -78.65%
• Proiezione del Ciclo Attuale: circa -72%
Ogni grande bull run è seguito da una correzione profonda – ma ogni ciclo forma un minimo più alto e un massimo più alto. Da 21K → 69K → 126K obiettivi, il trend a lungo termine rimane fortemente rialzista.
Le correzioni di mercato non sono la fine di Bitcoin – sono opportunità per un'accumulazione intelligente.
🔸 Allarga la visuale
🔸 Segui il trend
🔸 Pensa a lungo termine
🔸 Gestisci il rischio
La volatilità è temporanea. L'adozione è permanente.