Pattern di Candlestick
🔸I giapponesi hanno utilizzato i candlestick come tecnica di grafico e analisi per secoli. Pattern di Candlestick I candlestick aiutano principalmente a identificare i massimi e i minimi e sono più potenti quando confermano un indicatore occidentale. I pattern di candlestick sono impronte psicologiche di ciò che i trader stanno pensando in un dato momento. Ci sono circa 40 pattern di candlestick di inversione che variano da singoli candlestick a raggruppamenti di fino a cinque candlestick.
Comprendere i Candlestick
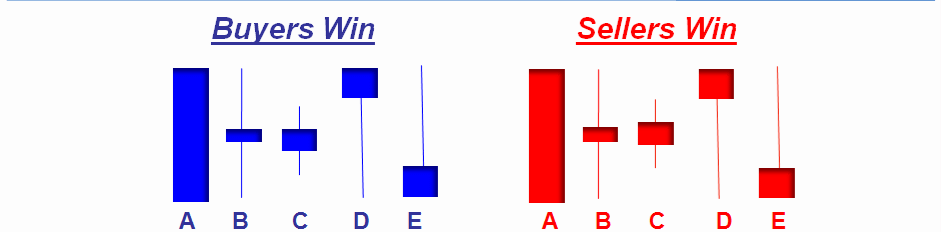
🔸"A" – corpo ampio senza code o ombre – molto rialzista o ribassista per un movimento di tendenza "B" - i prezzi di apertura e chiusura sono praticamente identici – nessun reale controllo – una pausa "C" mostra un intervallo di trading molto piccolo con un corpo stretto – una pausa senza un importante seguito "D" mostra l'apertura e la chiusura vicino al massimo con una lunga coda o ombra inferiore "E" mostra l'apertura e la chiusura vicino al minimo con una lunga coda o ombra superiore.
🔸Potresti dire che “A” è la candela più rialzista o ribassista. Ed è molto rialzista o ribassista in un forte trend rialzista o ribassista. Ma in alcuni casi, “D” a sinistra può essere più rialzista e “E” a destra può essere più ribassista.
Nel caso di “D”, si è combattuta una battaglia, e a un certo punto, i ribassisti erano in controllo. Alla fine della barra, i rialzisti hanno lottato fino a tornare indietro e hanno effettivamente portato la coppia di valute sopra il prezzo di apertura. Questa candela, se si trova alla fine di un trend ribassista, può potenzialmente segnalare un'inversione nel trend. Lo stesso vale per i venditori in “E” a destra.
Pattern Rialzisti e Ribassisti
1.Pattern Rialzisti
Martello
Martello Invertito
Pattern Piercing
Tweezer Inferiore
Ingolfante Rialzista
Stella del Mattino
2.Pattern Ribassisti
Ingolfante Ribassista
Stella della Sera
Uomo Pendente
Stella Cadente
Copertura Nuvolosa Scura
Tweezer Superiore
1.Pattern Ingolfante Rialzista
🔸Il mercato è in un trend ribassista definibile.
🔸La candela 1 ha un piccolo corpo reale rosso.
🔸La candela 2 si inverte dove il corpo verde ingloba completamente il corpo rosso del giorno precedente.
🔸Un segnale più forte si verifica quando il corpo della candela di inversione verde ingloba due o più corpi.
2.Pattern Ingolfante Ribassista
🔸Il mercato è in un trend rialzista definibile.
🔸La candela 1 ha un piccolo corpo verde in un trend rialzista.
🔸La candela 2 si inverte dove il corpo rosso ingloba completamente il corpo verde del giorno precedente.
🔸Un segnale più forte si verifica quando il corpo della candela di inversione rossa ingloba due o più corpi.
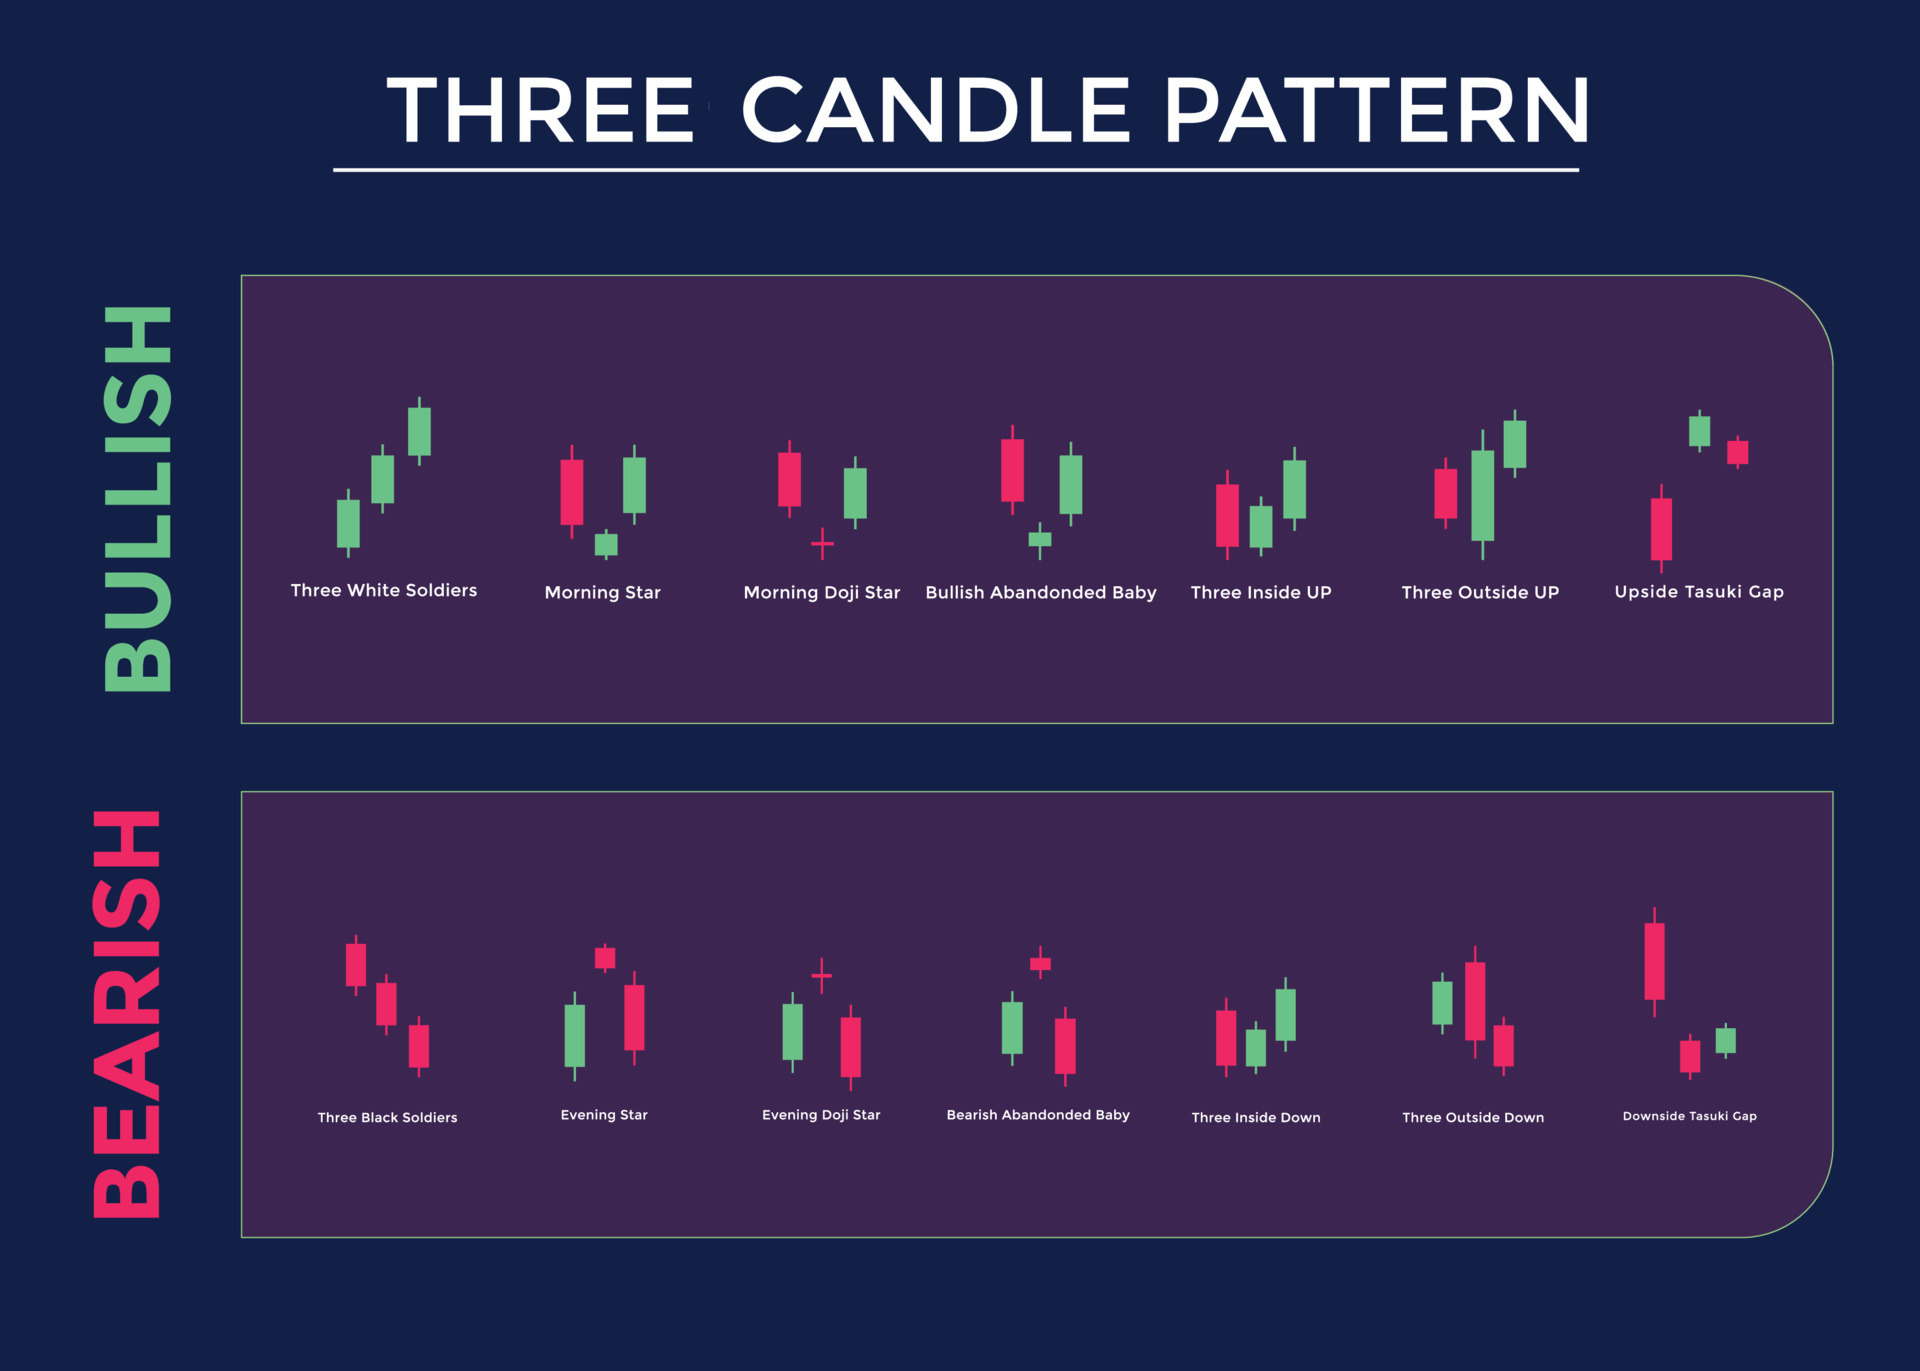
3.Pattern Stella del Mattino Rialzista
🔸Pattern rialzista a tre candele ai minimi swing.
🔸La candela 1 ha un corpo reale rosso alto.
🔸La candela 2 ha un corpo piccolo rosso o verde.
🔸La candela 3 chiude almeno al 50% nel primo corpo reale ed è una candela verde alta.
4.Pattern della Stella della Sera Ribassista
🔸Pattern ribassista a tre candele ai massimi swing.
🔸La candela 1 ha un corpo reale verde alto.
🔸La candela 2 ha un corpo reale piccolo verde o rosso.
🔸La candela 3 chiude almeno al 50% nel primo corpo reale ed è una candela rossa alta.
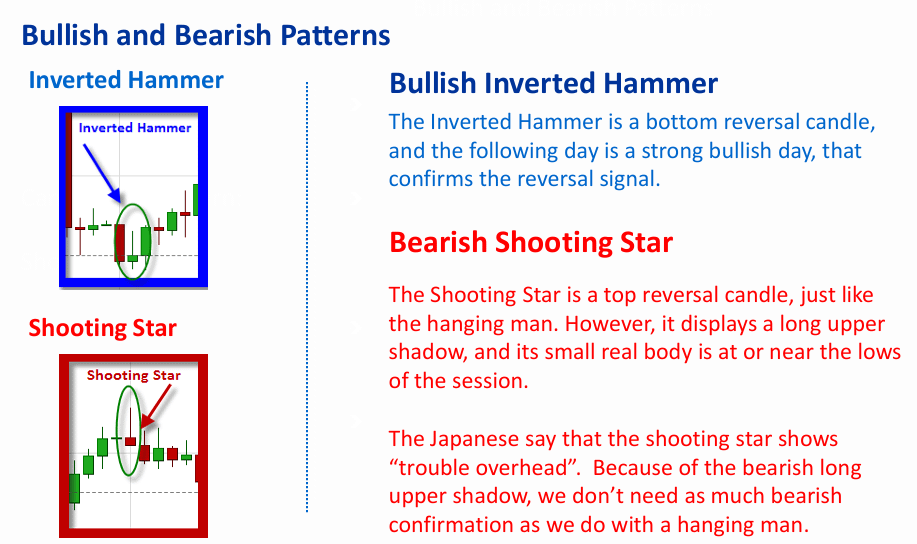
5.Martello Invertito Rialzista
🔸Il Martello Invertito è una candela di inversione dal basso, e il giorno successivo è un forte giorno rialzista, che conferma il segnale di inversione.
6.Stella Cadente Ribassista
🔸La Stella Cadente è una candela di inversione dal alto, proprio come l'uomo pendente. Tuttavia, mostra un lungo ombra superiore, e il suo corpo reale piccolo è a o vicino ai minimi della sessione. I giapponesi dicono che la stella cadente mostra “problemi in arrivo”. A causa dell'ombra superiore ribassista, non abbiamo bisogno di tanta conferma ribassista quanto ne abbiamo con un uomo pendente.
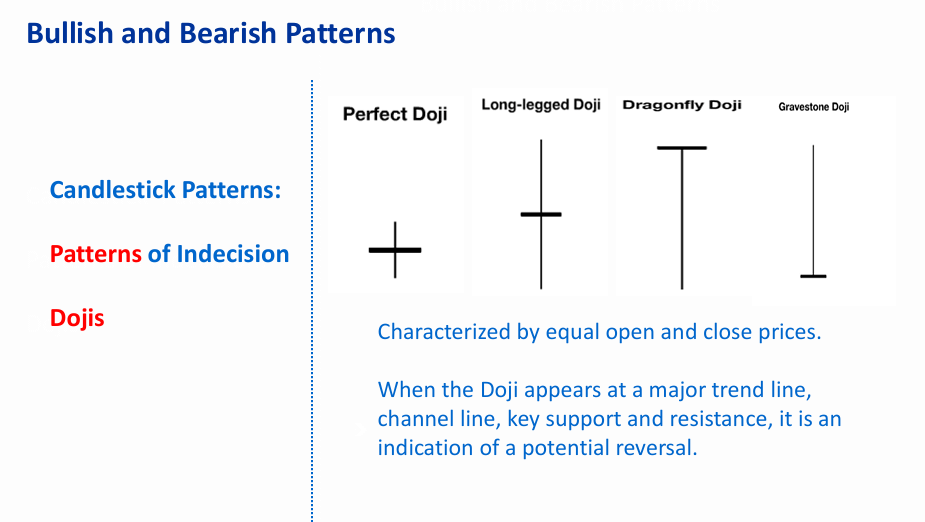
Pattern Candlestick: Pattern Rialzista e Ribassista Doji....
🔸Caratterizzato da prezzi di apertura e chiusura uguali. Quando il Doji appare su una linea di trend principale, linea di canale, supporto e resistenza chiave, è un'indicazione di un'inversione potenziale.