
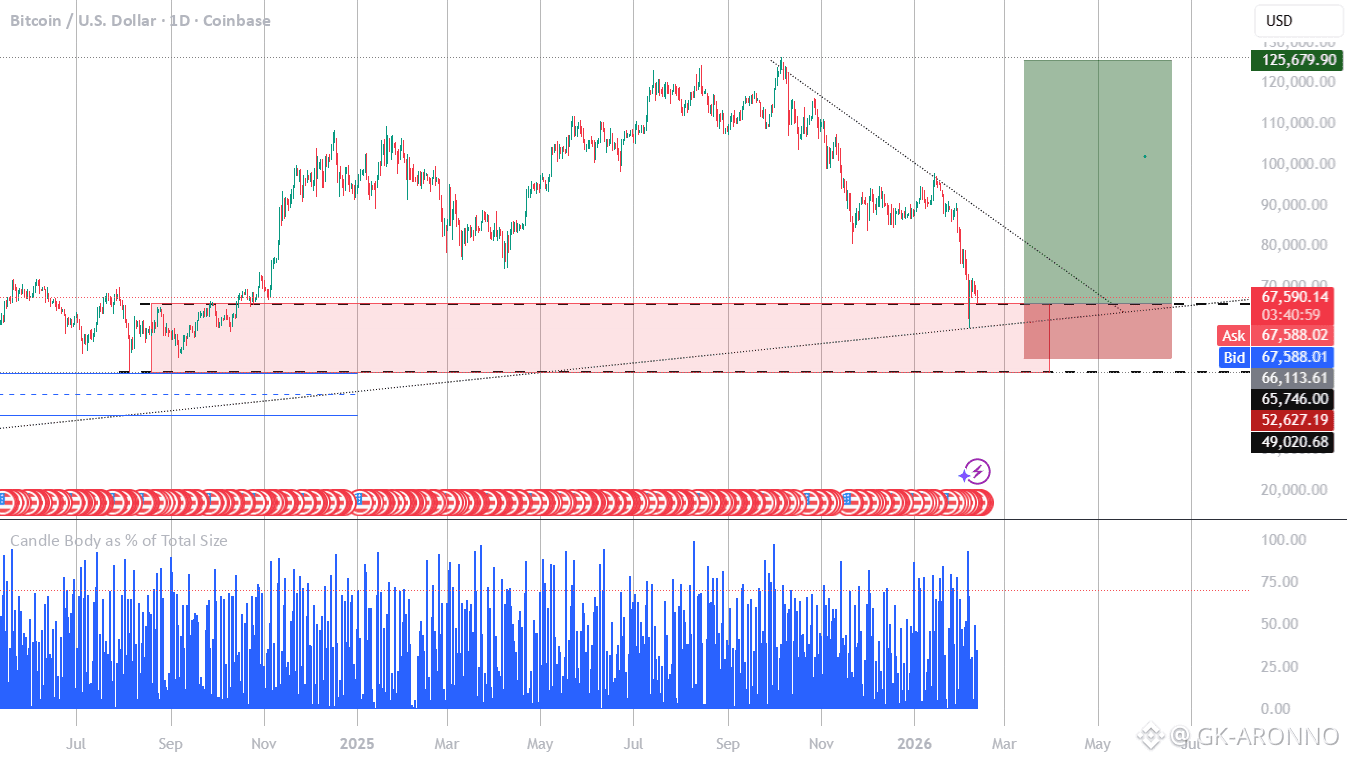
Bitcoin is currently retesting a key weekly demand zone after a sharp corrective move from the recent highs. Price has returned to a previously defended support region that aligns with both horizontal structure and the rising macro trendline.
Key observations:
Price has swept into a major weekly support block and is showing signs of stabilization.
This zone previously acted as resistance → support, making it structurally important.
The long-term ascending trendline is still intact for now, suggesting the macro uptrend is not fully broken unless we see a decisive weekly close below the zone.
Momentum on the drop has been aggressive, but we’re now approaching an area where buyers historically step in.
Bullish scenario:
If BTC holds this demand area and reclaims the 66–70K region on a weekly close, we could see a relief rally toward the mid-range resistance and potentially a continuation back toward the 90K–100K region. A higher low on the weekly timeframe would confirm strength.
Bearish scenario:
A clean breakdown and weekly close below the highlighted support + trendline would invalidate the bullish structure and open room for a deeper retrace into the next demand region below. That would signal a larger corrective phase.
What I’m watching:
Weekly close relative to the support box
Reclaim of lost support as resistance/flip
Volume expansion on any bounce
Market reaction around trendline confluence
At this level, patience is key. This is a reaction zone, not confirmation yet. Let price show whether buyers can defend and build structure before assuming continuation.
Not financial advice. For educational purposes only.
✅ Trade here on $BTC
