$BTC Bitcoin (BTC/USDT) Affronta una Forte Pressione di Vendita – È Vicino un Ritorno?
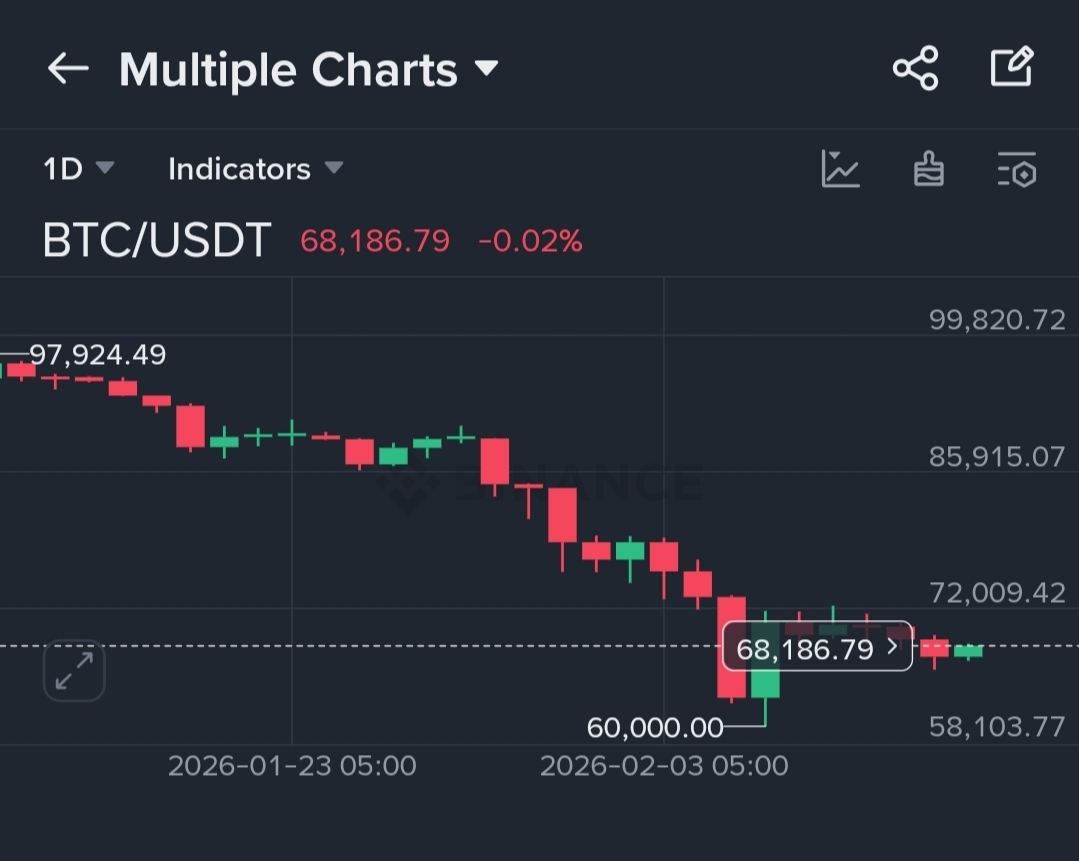
Bitcoin attualmente viene scambiato intorno a $68,186, mostrando una leggera variazione giornaliera di -0.02% sul timeframe 1D. Il grafico riflette una chiara tendenza ribassista a breve termine dopo aver subito un rifiuto vicino alla zona di $97,900.
📉 Panoramica del Mercato
Negli ultimi settimane, $BTC ha formato massimi e minimi sempre più bassi, confermando un momento ribassista. Dopo aver raggiunto un picco vicino a $97K, il mercato ha subito una forte pressione di vendita, spingendo il prezzo verso il livello di supporto psicologico di $60,000.
Un forte calo ha recentemente testato la zona dei $60K, dove i compratori sono intervenuti in modo aggressivo, formando una forte candela verde di recupero. Questo indica che i $60.000 stanno attualmente agendo come un livello di supporto importante.
🔎 Livelli chiave da osservare
Zone di supporto:
$60.000 – Supporto psicologico e strutturale importante
$58.000 – Area di consolidamento precedente
Zone di resistenza:
$72.000 – Resistenza immediata
$85.900 – Zona di offerta forte
$99.800 – Resistenza importante / massimo precedente
Se il Bitcoin rimane sopra i $60K, potremmo vedere un rally di sollievo a breve termine verso i $72K. Tuttavia, un fallimento nel mantenere il supporto potrebbe innescare una pressione ulteriore al ribasso.
📊 Sentiment di mercato
L'azione dei prezzi recente mostra:
Il momentum ribassista è ancora dominante
I compratori difendono il supporto inferiore
Volatilità in aumento vicino ai livelli chiave
I trader stanno ora aspettando una conferma:
Una rottura sopra i $72K potrebbe spostare il momentum al rialzo.
Una rottura sotto i $60K potrebbe aprire la porta verso i livelli di $55K–$52K.
💡 Cosa c'è dopo?
Il Bitcoin si trova in una zona di decisione. Il mercato si sta consolidando dopo un forte calo, e le prossime candele giornaliere probabilmente determineranno la direzione a breve termine. La conferma del volume sarà fondamentale per qualsiasi breakout o breakdown.
Per ora, pazienza e gestione del rischio rimangono fondamentali.