I analyzed the SOLANA chart on 3 different timeframes and they all tell one direction, which is bearish. Let's start from the lower timeframe chart to the higher timeframe chart.
4H TimeFrame Chart (I also shared a short setup and achieved take-profit)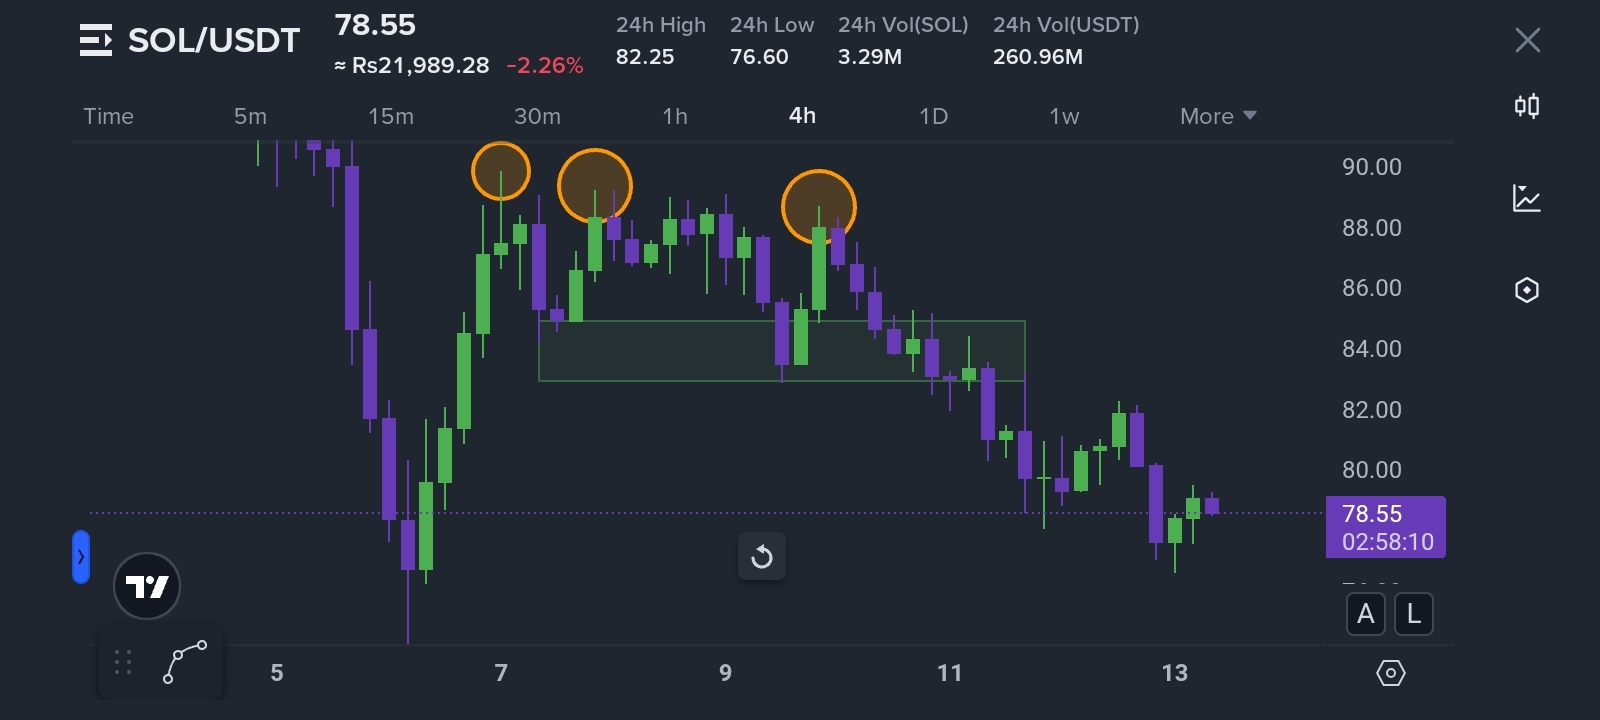
As you can see in the image, SOLANA formed a triple top chart pattern and broke down the neckline. On the neckline breakdown, I shared a short setup with Binancians and achieved take-profit.
1W TimeFrame (Understanding the Market Structure)
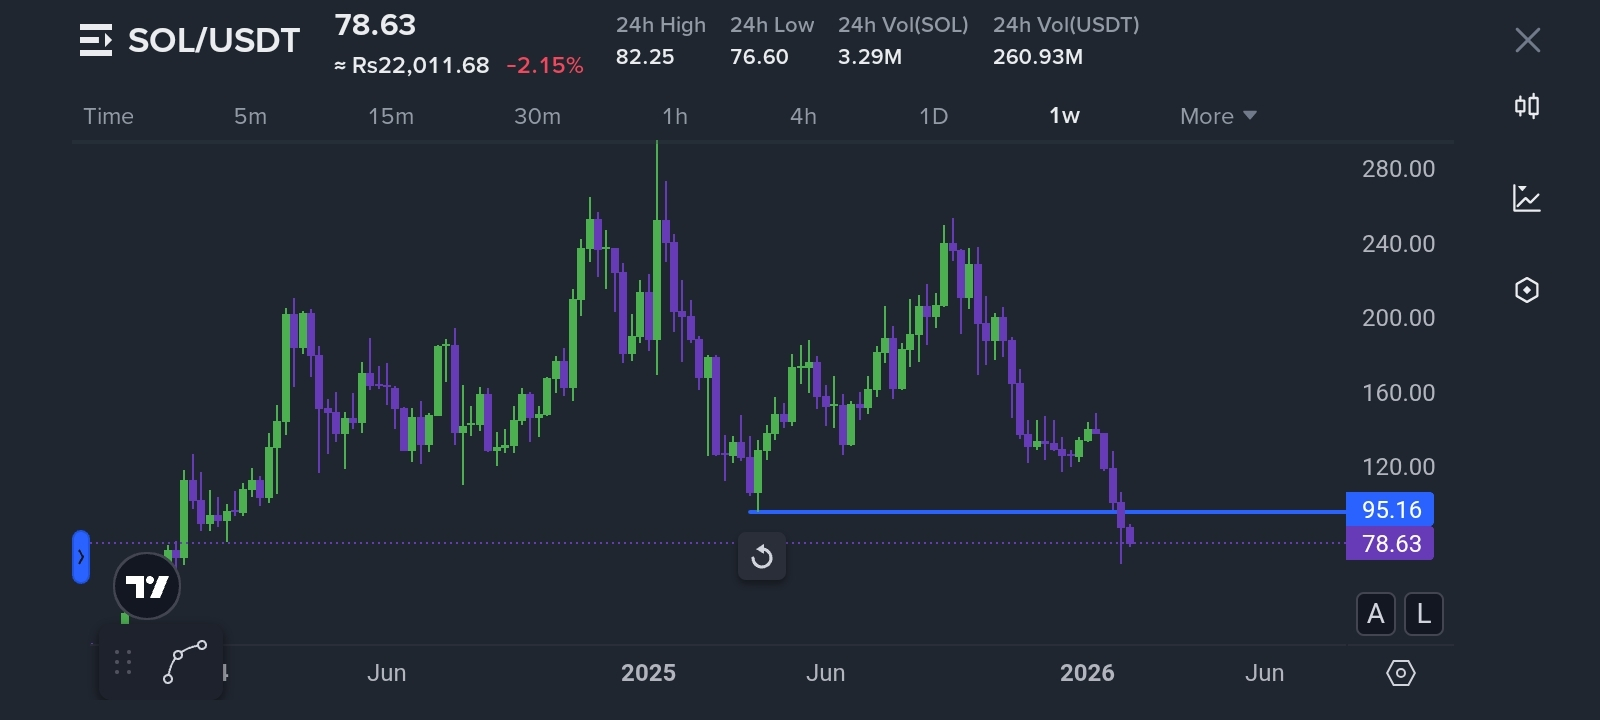
Solana broke down a low point and created a lower low, still falling down. No pullback confirmation yet.
1M TimeFrame (Catching Early Signals)
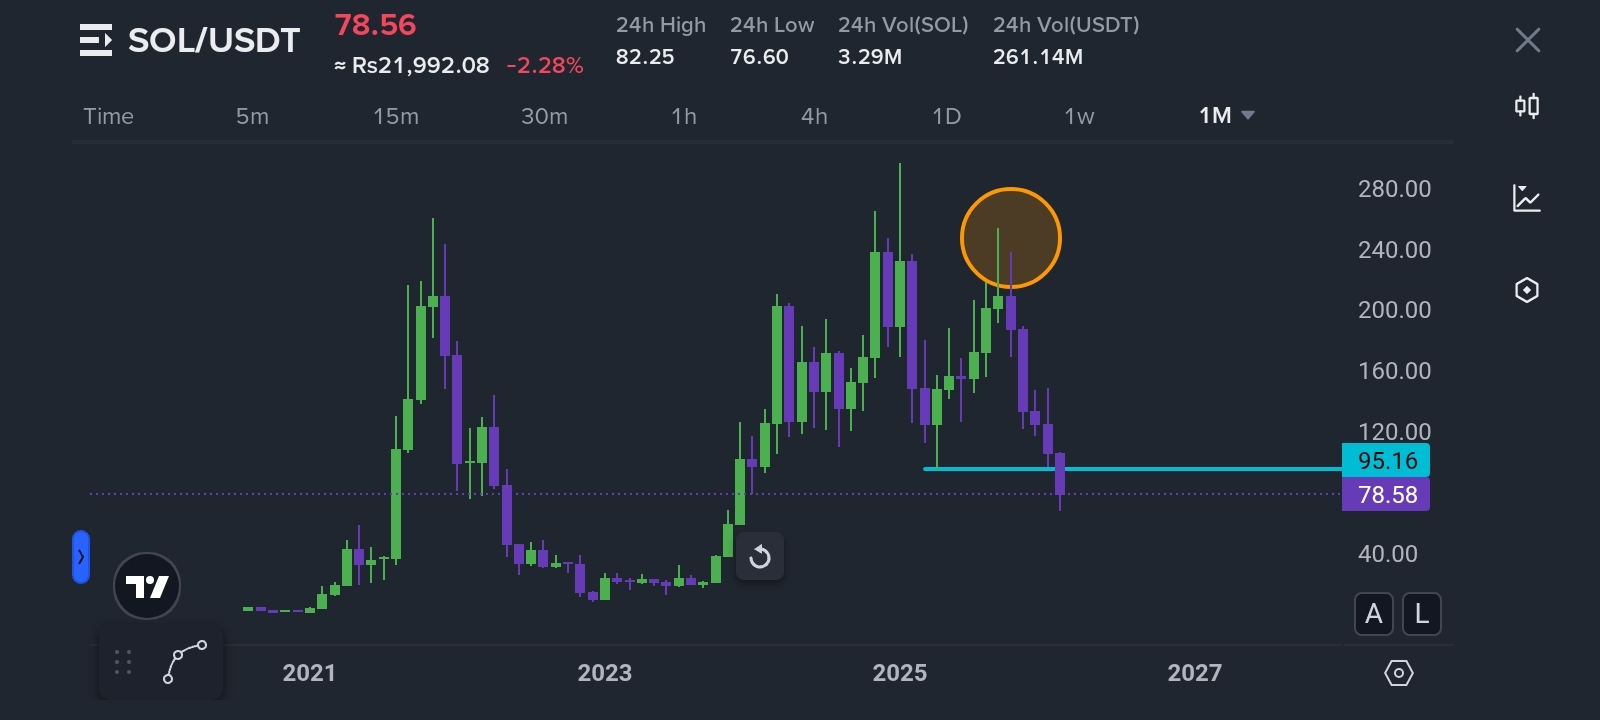
Solana, for the first time, failed to create a higher high. That is the first bearish sign before the fall, but most Binancians did not notice. Now Solana created a lower low, confirming the trend shift.
According to the 1M timeframe, the bearish trend keeps running for years.
If you enjoyed this article, a “Like” would really make my day! 💝