Price Action & Candlestick Patterns
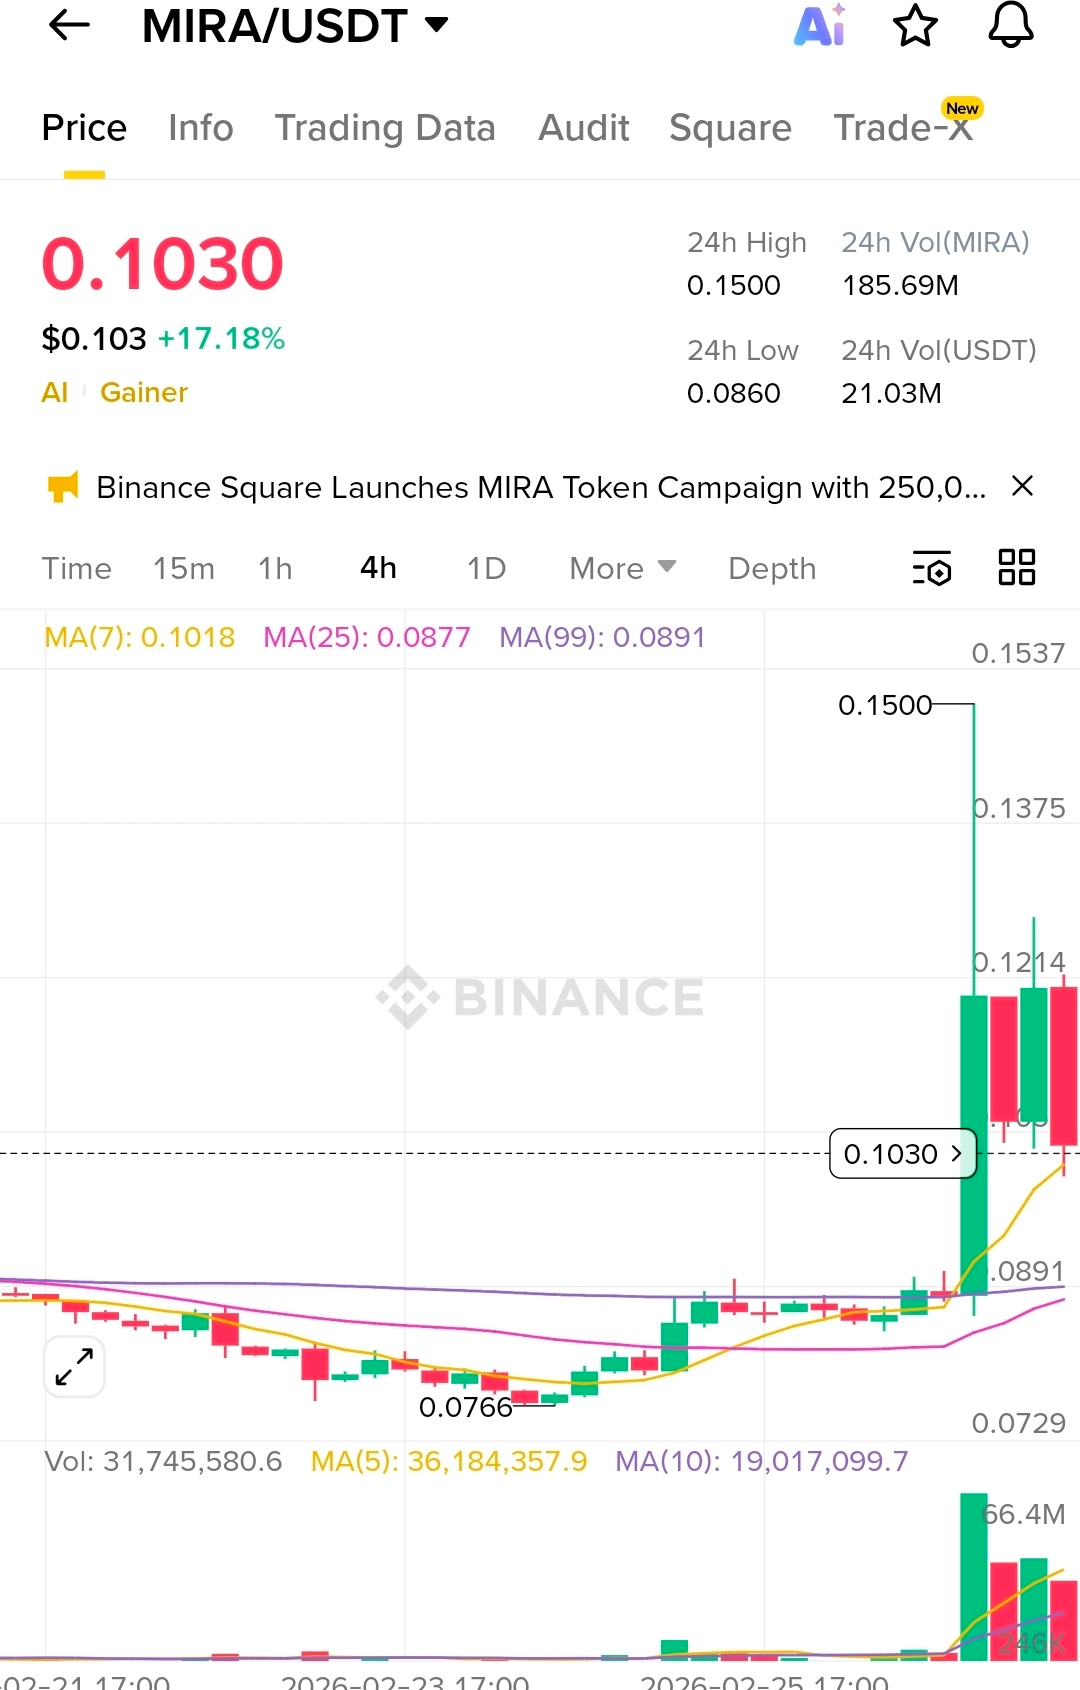
The chart shows a massive "God candle" (the long green wick) that reached $0.1500 before retracing.
The Spike: This was likely driven by the Binance Square MIRA Token Campaign (250,000 MIRA rewards) launched on Feb 26.
The Retracement: The price has settled around $0.1030. This suggests a "sell-the-news" reaction or profit-taking after the initial hype.
Current State: The price is consolidating above the previous base of ~$0.0850.
2. Moving Averages (MA)
MA(7) - Yellow: 0.1018
MA(25) - Pink: 0.0877
MA(99) - Purple: 0.0891
Analysis: The price is currently trading above all major MAs. Specifically, the MA(7) is acting as immediate dynamic support. A "Golden Cross" (short-term MA crossing above long-term) has occurred, which is a classic bullish signal.
3. Support and Resistance Levels
Immediate Resistance: 0.1214 (Recent candle body peak) and the psychological $0.1500 mark.
Immediate Support: 0.1018 (MA-7).
Strong Support: 0.0860 (24h low and MA-25/99