As of early March 2026, Bitcoin (BTC) is displaying significant volatility but remains in a broadly constructive trend. Following a period of consolidation, BTC has seen a resurgence in buyer interest, primarily driven by institutional spot ETF inflows and shifting macroeconomic sentiment.
Market Analysis
Resistance at $70,000: In the first few days of March, Bitcoin repeatedly tested the $70,000 psychological barrier. Initial rejections occurred due to geopolitical tensions in the Middle East and a strengthening US Dollar, which temporarily dampened "risk-on" appetite.
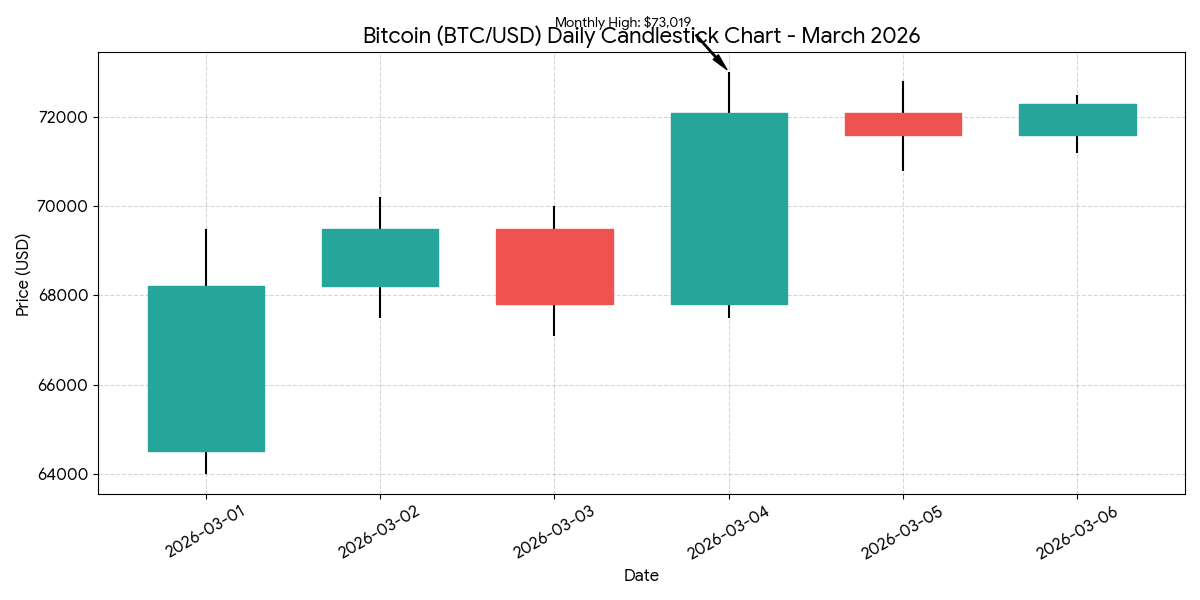
The March 4th Breakout: On March 4, BTC experienced an explosive move, gaining over 6% in a single day. This "short squeeze" pushed the price to a monthly high of $73,019, successfully flipping previous resistance into support.

Technical Outlook: Despite the recent rally, some technical analysts warn of a "Death Cross" (21-week vs. 100-week SMA) on the weekly timeframe. To maintain its bullish momentum, BTC needs to hold the $71,000 level; failure to do so could result in a "leg down" toward the $50,000 - $60,000 range.
Institutional Influence: The market remains highly sensitive to spot ETF flows. Consistent net buying from major institutional players like BlackRock and Fidelity continues to provide a structural floor for the price, distinguishing this cycle from previous bear-market recoveries.
Bitcoin (BTC/USD) Candlestick Chart
The chart below highlights the price action for the first week of March 2026, showing the successful breakout above the $70,000 zone
#BTC走势分析 #MarketRebound #AIBinance #BTCSurpasses$71000 #StockMarketCrash $ETH
