Current Market Performance: Bitcoin (BTC/USD)
As of March 6, 2026, Bitcoin continues to lead the market narrative, currently stabilizing in the $72,000 range. After the "March 4th breakout" where it briefly touched a monthly high of $73,019, the price has entered a brief consolidation phase.
Quick Technical Snapshot
Support: Currently established at $71,500. A drop below this could see a retest of the psychological $70,000 level.
Resistance: Bulls are facing rejection near $72,850. A clean break above this with high volume is needed to aim for new all-time highs.
Trend: Short-term bullish; however, the "Death Cross" on the weekly timeframe (mentioned in earlier analyses) remains a background risk that traders are monitoring.
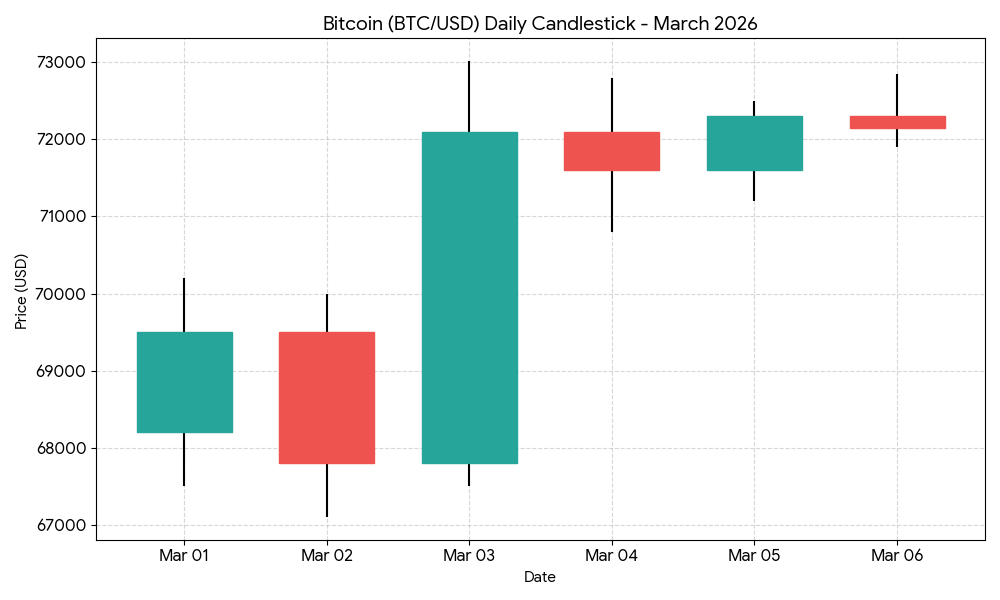
Bitcoin Daily Candlestick Chart
Performance: March 1 – March 6, 2026

How to Read This Chart
Green Candles: Buying pressure was stronger; the price closed higher than it opened.
Red Candles: Selling pressure dominated; the price closed lower than it opened.
The Wicks (Thin lines): Represent the highest and lowest prices reached during that 24-hour period.
The Bodies (Thick rectangles): Represent the difference between the opening and closing prices.