 If there is one skill that separates average traders from profitable ones, it is reading candlestick patterns. Candles are not just random shapes on a chart — they represent real emotions in the market: fear, greed, hesitation, and momentum.
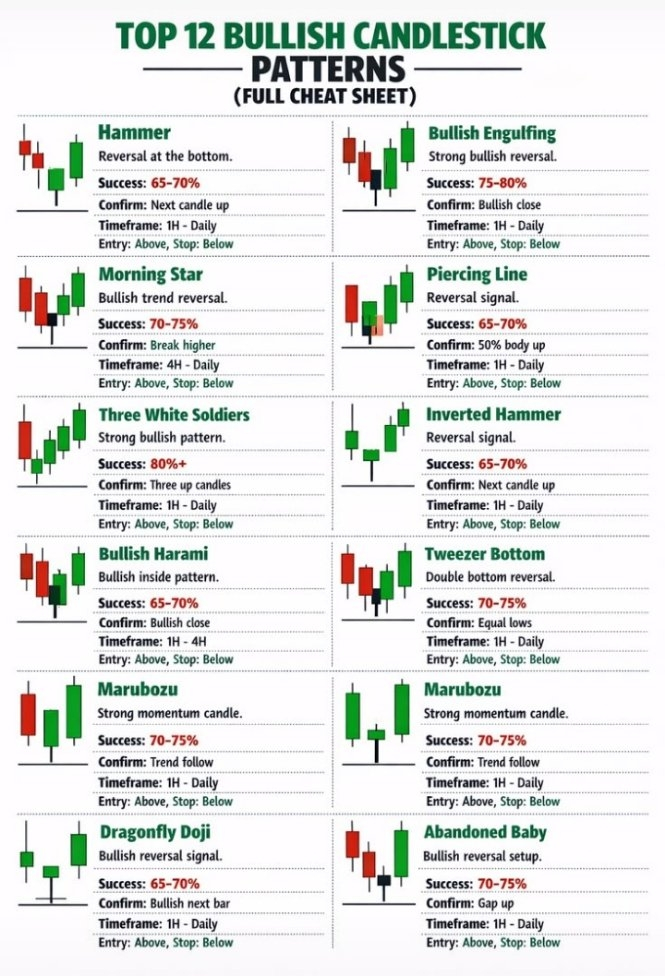
When I started trading crypto, I realized that learning candlestick patterns helped me understand when buyers are taking control and when sellers are dominating. Below are 12 powerful candlestick patterns that every trader should recognize.
1. Hammer
The Hammer appears after a downtrend and signals a potential bullish reversal.
It has a small body with a long lower wick, showing that sellers pushed the price down but buyers stepped in strongly and pushed it back up. This indicates buying pressure entering the market.
When I see a hammer near strong support, I start watching for a potential bounce.
2. Inverted Hammer
The Inverted Hammer also appears after a downtrend but looks different.
It has a small body with a long upper wick. This shows that buyers attempted to push the price higher. Although sellers brought it down again, the buying attempt signals weakening bearish momentum.
If confirmed by the next candle, it can signal a reversal.
3. Bullish Engulfing
This is one of the strongest bullish reversal patterns.
A large green candle completely engulfs the previous red candle, showing that buyers have taken full control.
Whenever I see this pattern near support levels, it often signals the beginning of a strong upward move.
4. Bearish Engulfing
The opposite of the bullish engulfing pattern.
A large red candle completely engulfs the previous green candle, indicating that sellers have overwhelmed buyers.
This pattern usually appears near resistance levels and can signal the start of a downtrend.
5. Doji
The Doji candle represents market indecision.
The opening and closing prices are almost the same, creating a small body with wicks on both sides.
When I see a Doji after a strong trend, it often signals possible trend exhaustion or reversal.
6. Morning Star
The Morning Star is a three-candle bullish reversal pattern.
It forms like this:
A strong red candle
A small indecision candle
A strong green candle
This pattern signals that selling pressure is fading and buyers are stepping in.
Traders often consider this a reliable signal for trend reversal.
7. Evening Star
The Evening Star is the bearish version of the Morning Star.
It forms after an uptrend:
A strong green candle
A small indecision candle
A strong red candle
This indicates buyers losing momentum and sellers taking control.
8. Shooting Star
The Shooting Star appears at the top of an uptrend.
It has a small body and a long upper wick, showing that buyers pushed prices higher but sellers quickly forced them back down.
This pattern often signals a potential bearish reversal.
9. Hanging Man
The Hanging Man looks similar to a hammer but appears at the top of an uptrend.
The long lower wick shows that selling pressure has started to appear, even though buyers managed to close the candle higher.
It can signal that the uptrend may soon weaken.
10. Three White Soldiers
This is a strong bullish continuation pattern.
It consists of three consecutive strong green candles, each closing higher than the previous one.
This pattern shows consistent buying pressure and often indicates the beginning of a strong rally.
11. Three Black Crows
The opposite of Three White Soldiers.
It consists of three strong red candles, each closing lower than the previous one.
This pattern shows strong selling momentum and can signal a major downtrend.
12. Spinning Top
The Spinning Top represents uncertainty in the market.
It has a small body with long upper and lower wicks, showing that both buyers and sellers fought for control but neither side won.
When I see spinning tops forming repeatedly, it often means the market is preparing for a big move.
Final Thoughts
Candlestick patterns are powerful tools, but they should never be used alone. I always combine them with:
• Support and resistance
• Volume analysis
• Trend indicators
• Market sentiment
In crypto trading, understanding these patterns helps me avoid emotional decisions and follow the story the market is telling.
The chart always speaks you just need to learn how to read it.
