

 Current Price:** ~$91.70 (-0.08%)
---
### Market Structure
- Extended downtrend from $100+ (early Feb) with a series of lower highs and lower lows
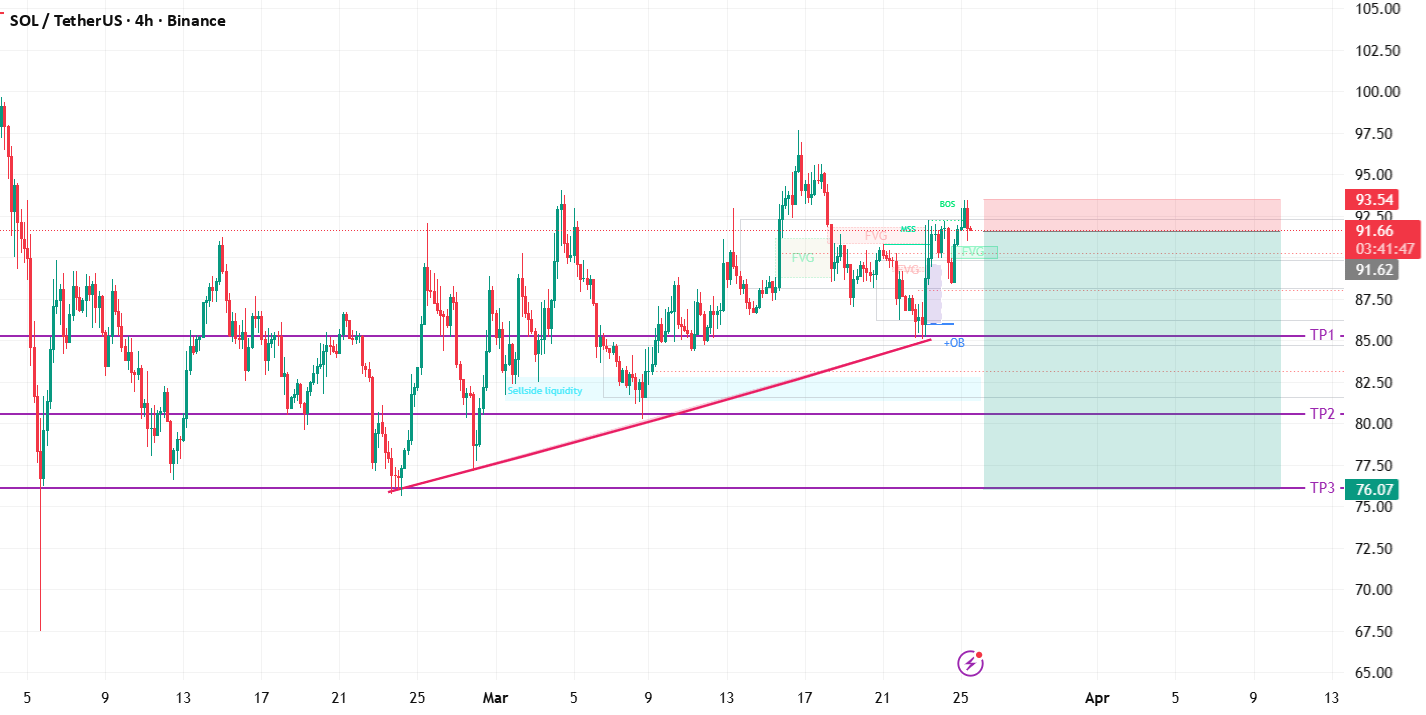
- BOS (Break of Structure) confirmed to the upside recently (~$92.50 area) — price broke above the last swing high
- However, price immediately MSS'd back down after the BOS, suggesting the BOS was a liquidity grab rather than a genuine reversal
- This is a textbook "BOS into MSS" trap — retail traders buy the breakout, smart money distributes into them
---
### ICT Concepts Identified
| Concept | Location | Implication |
|--------|----------|-------------|
| BOS | ~$92.50 | Breakout above swing high — used to sweep buyside liquidity |
| MSS | ~$91.50–$92.00 | Immediate structure shift back bearish post-BOS |
| FVG x3 | ~$88–$92 zone | Multiple imbalances stacked — price currently sitting inside them |
| +OB (Bullish OB) | ~$85–$86 | Last bullish candle before impulse up — now a key bearish mitigation block on the way down |
| Sellside Liquidity | ~$81–$83 | Equal lows from early March consolidation — prime sweep target |
| Liquidity Trendline | Pink diagonal (~$76–$92) | Rising trendline = liquidity magnet, not support — stops resting below it |
| Entry Zone | $91.62–$93.54 | Current pink supply box — optimal short location |
---
### Full ICT Trade Narrative
1. Phase 1 — Sellside Liquidity Build: Price consolidates mid-Feb through early March, printing equal lows at ~$81–$83 and building a rising trendline — both are liquidity pools
2. Phase 2 — Trendline Liquidity Run: The pink diagonal trendline engineers a rally, running stops above swing highs and printing the BOS at ~$92.50
3. Phase 3 — BOS Trap & Distribution: The BOS sweeps buyside liquidity above the previous swing high (~$92.50), trapping breakout longs — smart money distributes here, confirmed by the immediate MSS
4. Phase 4 — Current Retracement (Premium): Price has retraced back into the FVG stack + supply zone ($91.62–$93.54) — this is a premium PD array, ideal for short entry
5. Phase 5 — Delivery Path: Price expected to break the trendline (confirming it as liquidity, not support), sweep sellside liquidity at ~$81–$83, then deliver through the +OB (~$85) toward TP3 at $76.07
---
### PD Array Delivery Sequence
```
Current Zone ($91–$93) → FVG fill rejection
→ Break below trendline liquidity
→ +OB mitigation ($85–$86)
→ Sellside liquidity sweep ($81–$83)
→ TP2 ($80) → TP3 ($76.07)
```
---
### Key Differentiator vs ETH/BTC
SOL's setup has an additional layer of confluence — the triple FVG stack directly beneath current price creates a magnet effect pulling price down, and the trendline liquidity adds a mechanical reason for a sharp move once broken. The BOS→MSS sequence is the cleanest trap structure of the three setups analyzed today.
---
### Conviction Level
**Very High** — BOS trap confirmed, MSS printed, price in premium FVG zone, trendline liquidity below, sellside liquidity pool clearly visible. Multiple ICT concepts aligning at the same decision point.
| Level | Price | Type |
|-------|-------|------|
| Entry | $91.62–$93.54 | Supply / FVG zone |
| Stop | Above $93.54 | Above buyside liquidity |
| TP1 | $85.00 | +OB mitigation |
| TP2 | $80.00 | Sellside liquidity |
| TP3 | $76.07 | Macro support / full target |
> ⚠️ Educational analysis only. Not financial advice. Always size positions appropriately.
