

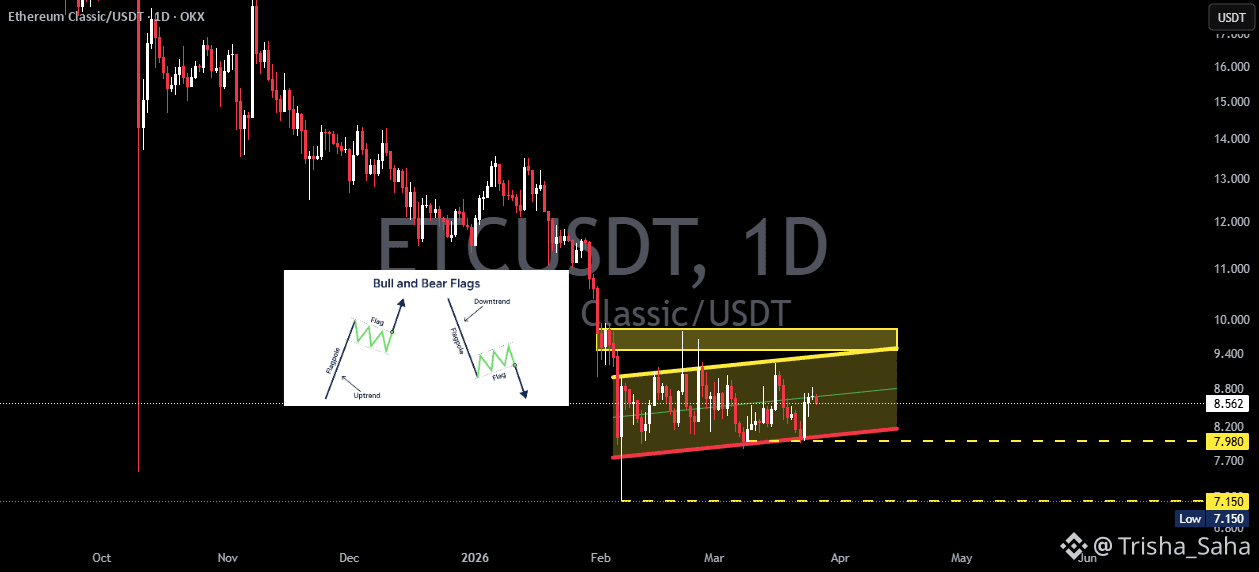
On the 1D timeframe, ETC/USDT remains in a clear downtrend after rejection from the upper zone (around $16–17). Following a sharp decline, price is now forming a narrow ascending channel, indicating a potential Bear Flag pattern.
This structure suggests that the current upward movement is likely just a temporary retracement before a possible continuation of the downtrend.
---
📊 Pattern Explanation: Bear Flag
A Bear Flag consists of two main components:
Flagpole:
A strong downward move from around $13–$10 down to the $8 area → showing strong selling pressure.
Flag:
A rising consolidation channel (yellow zone) → a weak counter-trend movement.
Key characteristics visible on the chart:
Small upward channel against the main trend
Decreasing volume during consolidation
Repeated rejection at the resistance zone (upper yellow area)
👉 This strengthens the validity of a bearish continuation pattern.
---
📍 Key Levels
Strong Resistance: $9.4 – $9.8 (upper yellow zone)
Minor Support: $7.98
Major Support: $7.15 (previous low)
---
🚀 Bullish Scenario
Bullish momentum is only valid if the Bear Flag gets invalidated:
Strong breakout above $9.8
Candle close above resistance + successful retest
Significant increase in volume
Bullish Targets:
$10.5 – $11.5
Extension toward $12 if momentum continues
👉 This indicates buyers are shifting the structure from bearish to neutral/bullish.
---
📉 Bearish Scenario (Primary Scenario)
The main scenario based on the pattern:
Breakdown from the channel (lower red trendline)
Close below $7.98
Confirmation via a failed retest
Bearish Targets:
$7.15 (major support)
If breakdown continues: $6.5 – $6.0
👉 This represents a continuation of the previous downtrend.
---
⚠️ Important Notes
As long as price remains inside the channel → consolidation / waiting phase
Fake breakouts are possible in both directions
Volume is the key factor for confirming the next move
---
🏁 Conclusion
The current structure strongly resembles a Bear Flag continuation pattern, with a higher probability of a bearish move unless price breaks above the key resistance.
However, an upside breakout must still be considered as a potential invalidation scenario that could trigger a strong rally.
