

Solana is showing strength against Bitcoin while also trying to stabilize at a major support zone on its weekly dollar chart. One setup points to possible near term outperformance, while the other shows the broader trend still depends on whether wedge support holds.
Solana Tests Breakout Against Bitcoin as $SOL/$BTC Presses Key Resistance
Solana is showing signs of a possible breakout against Bitcoin based on the daily SOL BTC chart shared by trader gnarleyquinn. The pair is testing a key resistance level while staying above an upward trendline which suggests growing strength. If this resistance is broken it could signal stronger performance from Solana compared to Bitcoin
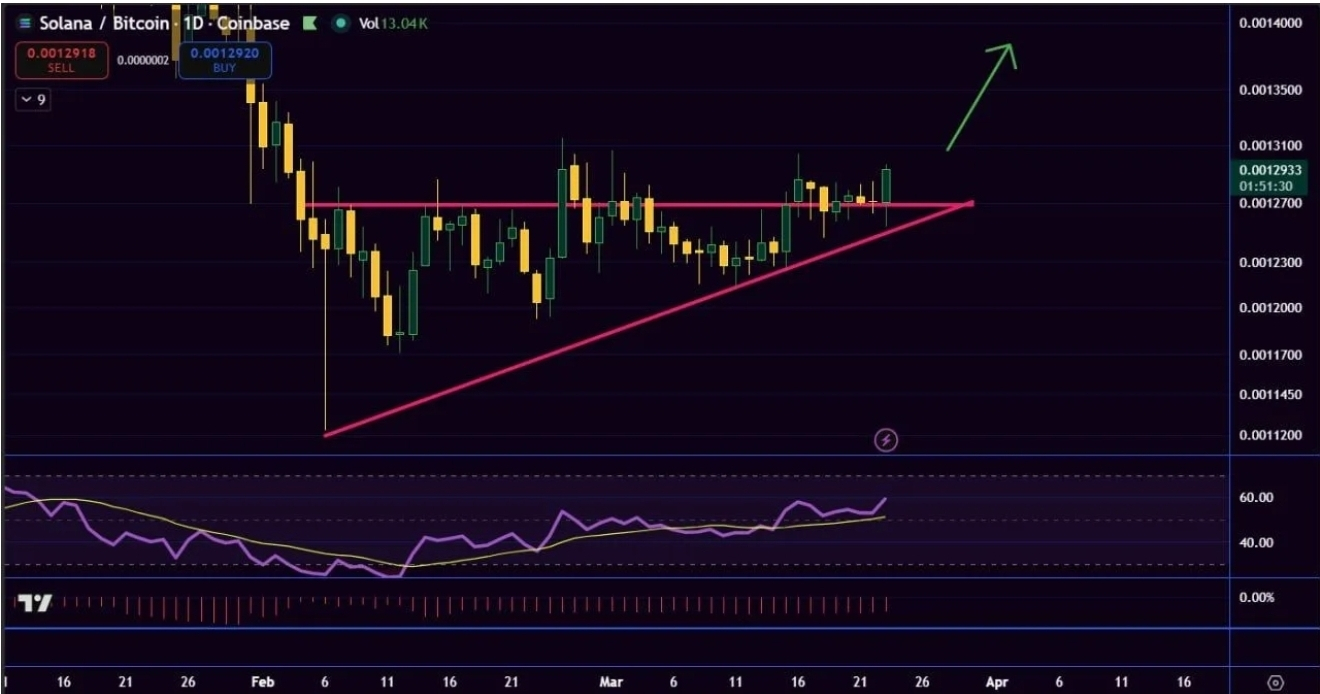
The daily Coinbase chart shows Solana versus Bitcoin sitting near the top of a tight range that has been forming since February. Price has been creating higher lows along an upward support line while repeatedly testing a flat resistance area near recent highs a setup that usually signals pressure building before a move.
Momentum is also picking up. The relative strength index is trending higher and has crossed above its signal line showing improving strength as price approaches resistance. This has led traders to see potential for Solana to outperform Bitcoin if momentum continues.
The key level to watch is that horizontal resistance. A clean close above it would support the idea of short term strength for Solana. If it gets rejected the rising support still holds the structure together unless it breaks.
Overall the chart looks close to a decision point not a confirmed move yet. Solana is gaining strength but still needs a breakout to signal a clearer upside trend.
Solana Holds Lower Wedge Support as Weekly Structure Tightens
Solana is still trading within a wide expanding wedge on the weekly chart based on analysis shared by CryptoJack. The SOL USDT pair is currently sitting close to the lower edge of the pattern after dropping significantly from the upper resistance area
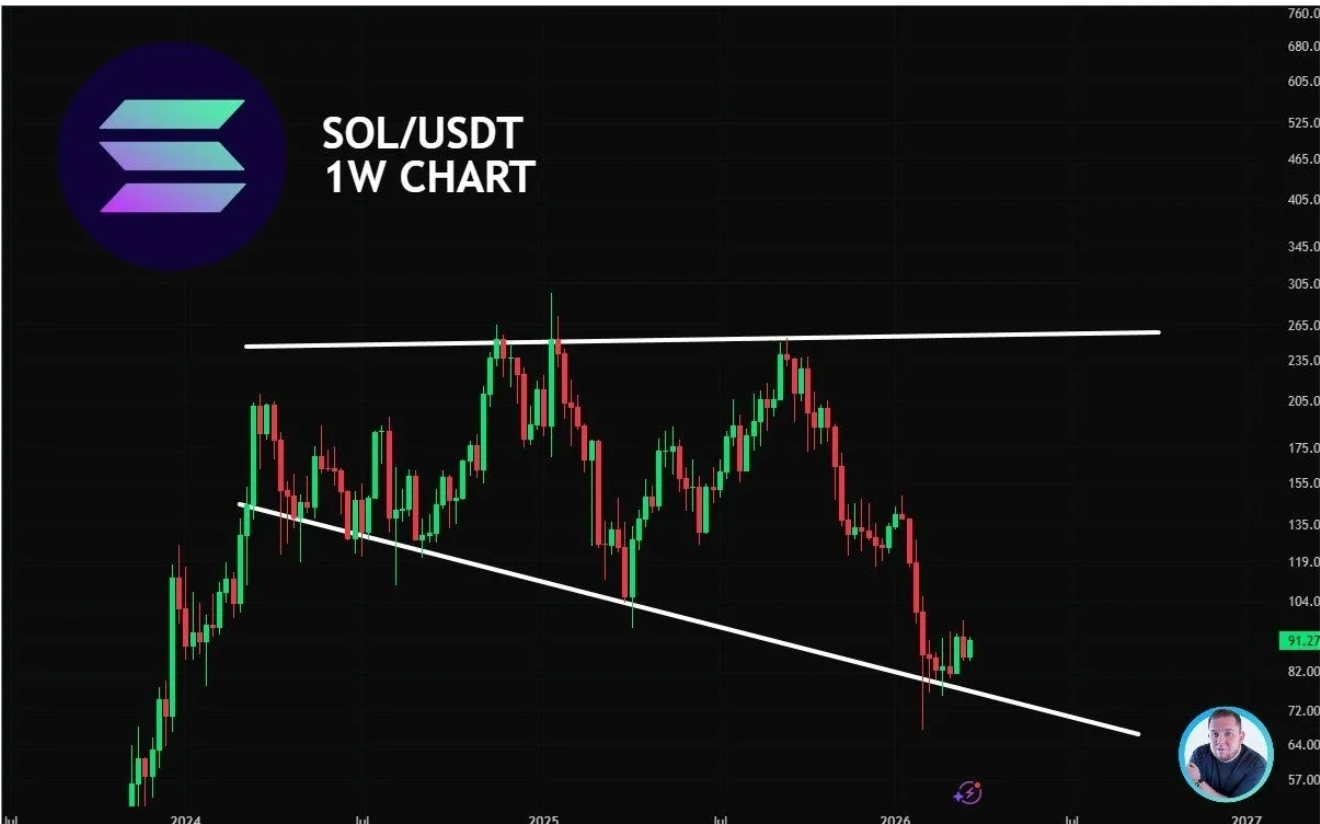
The chart shows two trendlines moving apart, with the top line acting as resistance where price kept getting rejected, and the bottom line serving as support during the recent drop. After a sharp decline over the past months, Solana has started to stabilize near that lower level and seen a small bounce.
This level is now the most important part of the structure. As long as Solana holds above it, there is room for a wider recovery within the wedge. But if it breaks below, the setup weakens and could lead to further downside.
Right now, the weekly chart is not showing any breakout. It reflects a market sitting near a key support zone in a long term pattern. The next move will depend on whether Solana can build a stronger rebound from this lower boundary.