
I've been following $SIGN for months now, and something clicked for me last week that I haven't seen anyone else really call out. Most folks are staring at the chart, the big FDV gap, and that April unlock date, muttering about dilution and waiting for the shoe to drop. Fair enough on paper it looks like classic early-stage risk. But after digging through the live numbers, the on-chain flows, and how the token actually moves day to day, I keep coming back to the same non-obvious takeaway: this thing has already built a self-sustaining liquidity engine through real product usage, and it's quietly positioned to chew through the next supply wave without the meltdown the market seems to be pricing in.
Let me walk you through why I think that, straight from the data I'm watching.
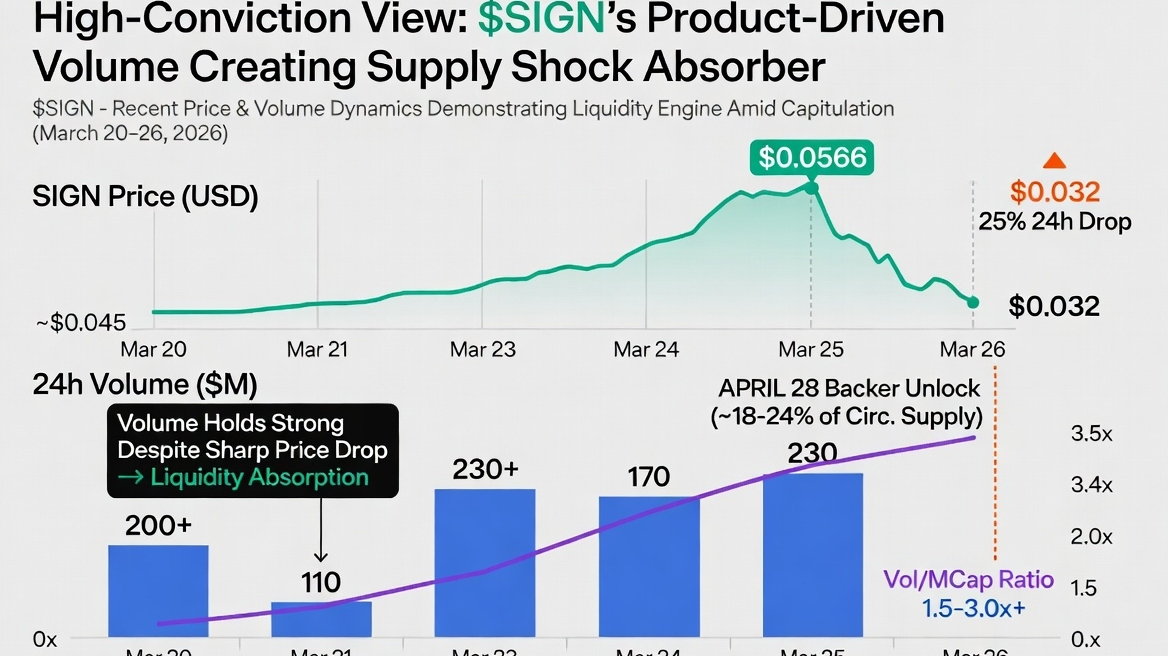
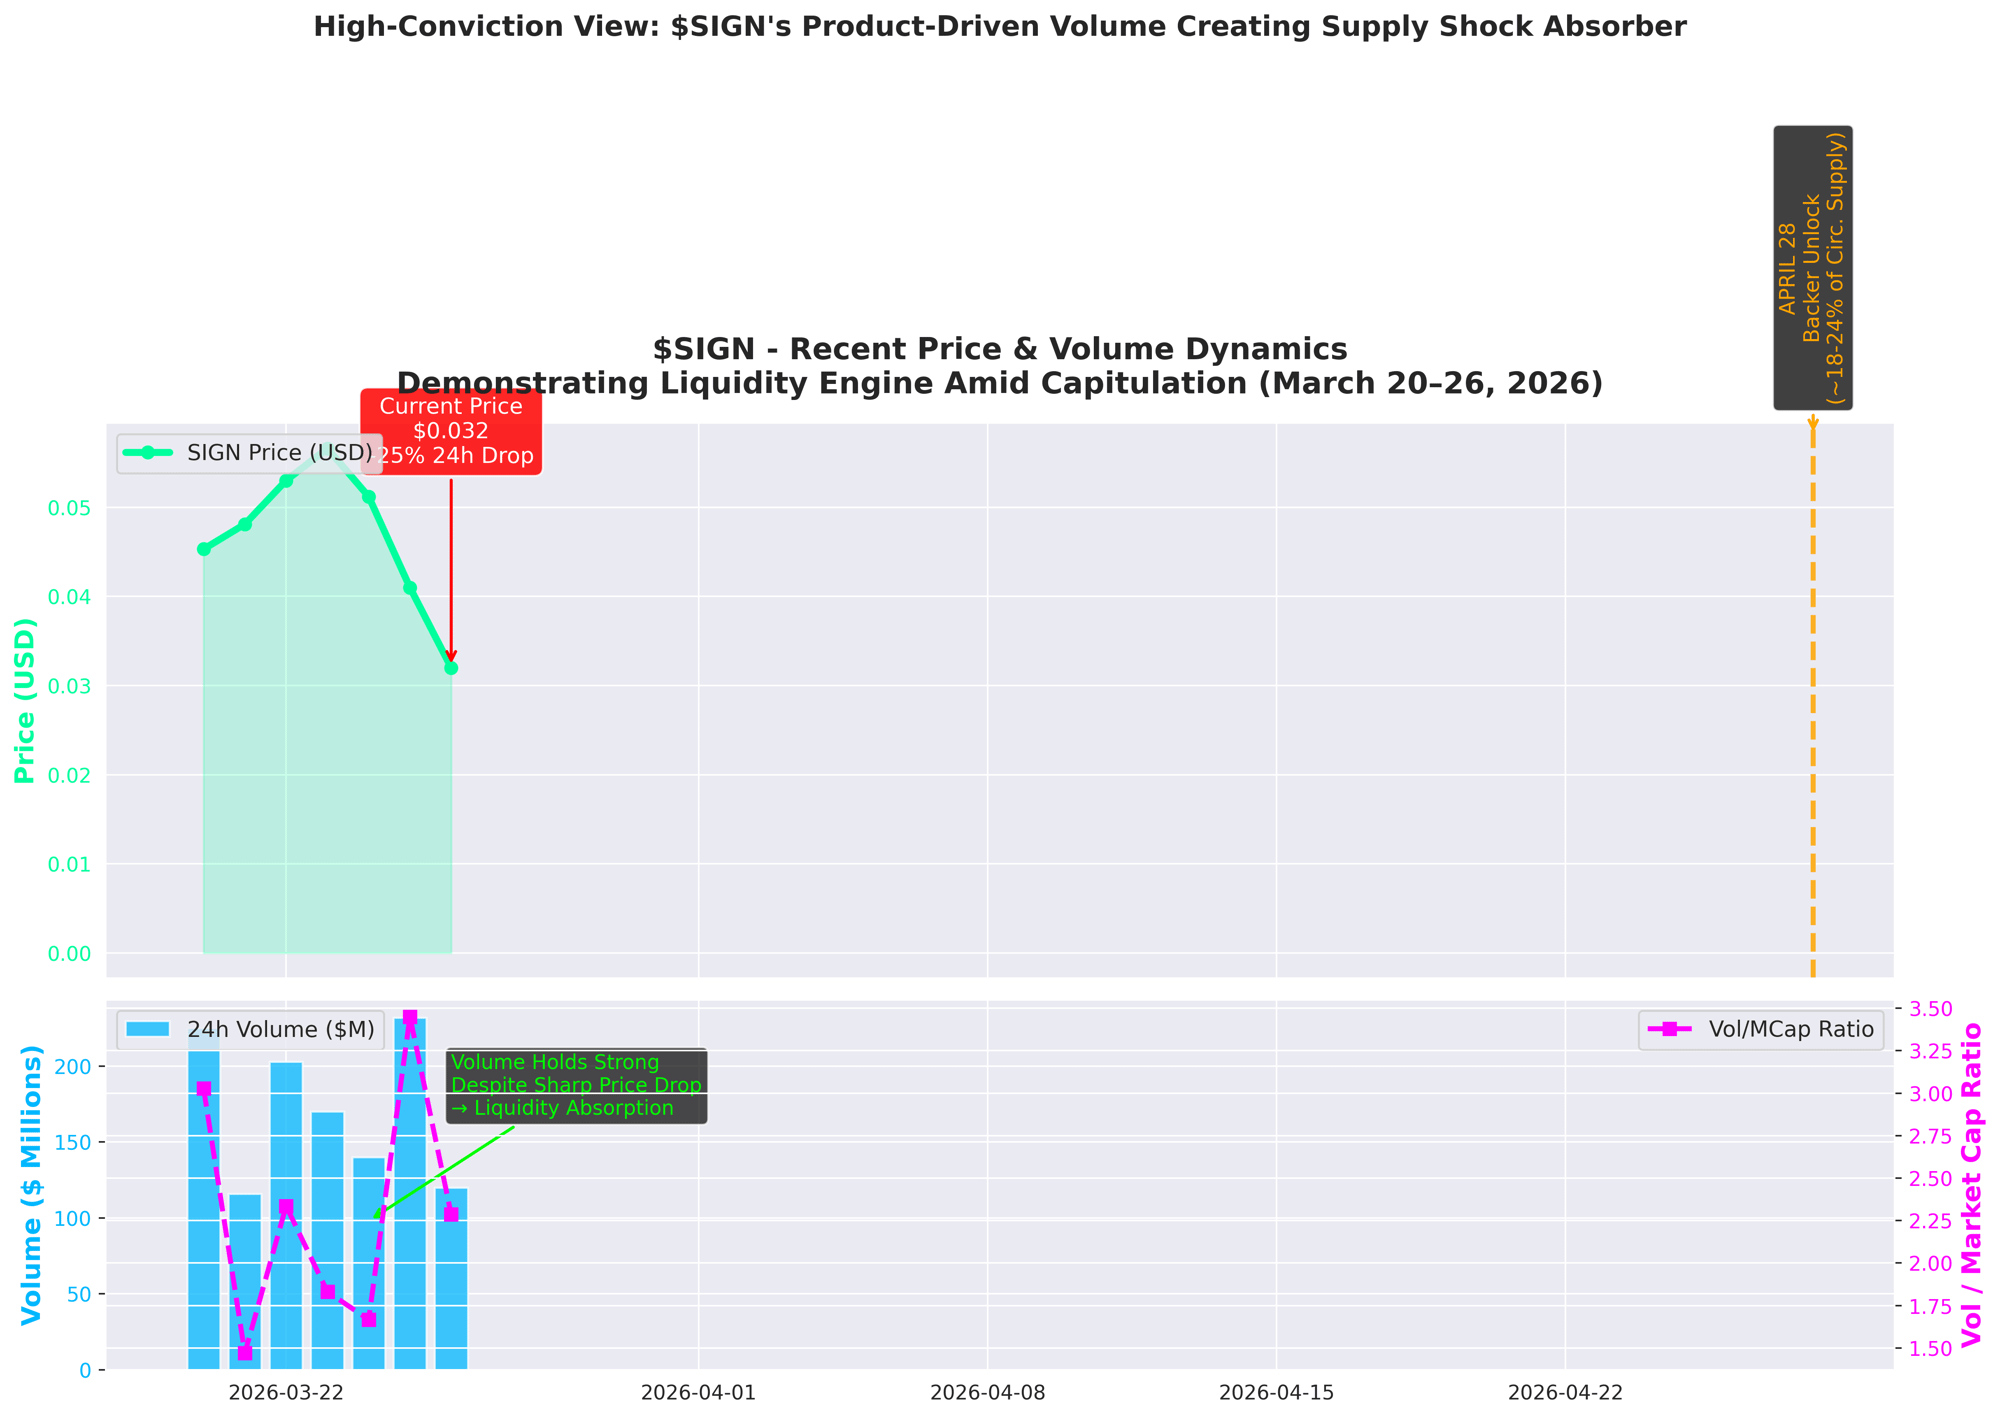
Right now the token sits at roughly $0.032 with a $52.5 million market cap and about $110 million in 24-hour volume. That's north of 2x turnover on the entire float, even after a rough 25% drop in the last day. In most tokens this size, volume evaporates when price wobbles; here it doesn't. The excess flow isn't random retail flipping it's tied directly to TokenTable executions where SIGN gets pulled in for fees, vesting logic, and incentive routing. Every time a government partner or enterprise runs a distribution, the token sees mechanical demand. That kind of velocity doesn't disappear overnight; it creates a buffer that new supply can flow into.
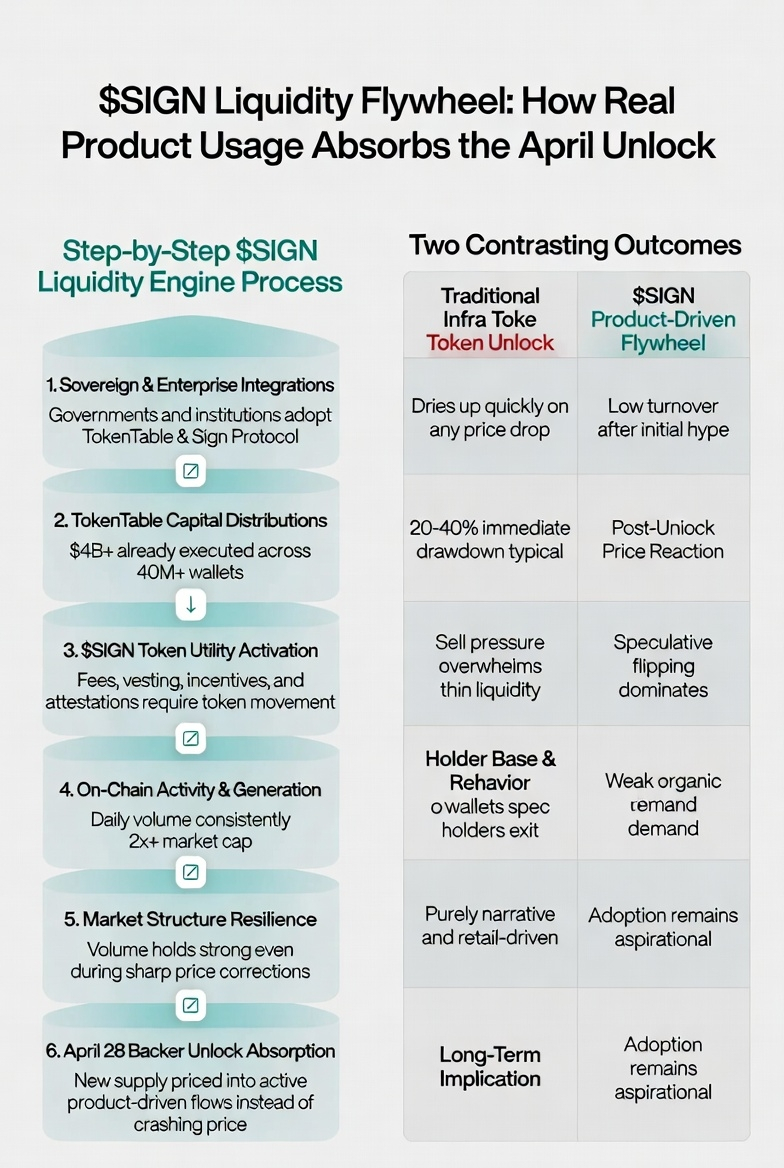
The float itself is still tight at 1.64 billion out of 10 billion total, which is why the FDV sits around $320 million. People fixate on that gap as pure risk. What they miss is that the protocol's own distribution engine is already generating recurring buy pressure and on-chain activity that effectively narrows the economic impact of dilution. The April 28 backer unlock roughly 296 million tokens, or about 18% of today's circulating supply is real, no question. But when you layer it on top of daily volume that's already processing multiples of the market cap, it starts to look more like a liquidity event than a fire sale. The same mechanics that keep volume elevated today will price those incremental tokens into active circulation rather than letting them overhang the market.
Zoom out to the usage side and the picture sharpens. TokenTable has already pushed over $4 billion in actual capital distributions to more than 40 million wallets across hundreds of projects. That's not roadmap fluff those are executed runs, on-chain and verifiable, creating a broad base of participants who interact with the token through grants, incentives, or unlocks. Most infrastructure tokens at this stage are still hoping for adoption; $SIGN is living inside its own product loop. Each new distribution run doesn't just add wallets it adds sticky, utility-driven holders who need the token to keep moving capital. That's the flywheel most price models ignore.
Price action tells its own story too. We've seen violent swings down 75% from last September's highs, scraping near all-time lows in February but the volume never collapsed with it. That disconnect is rare. It suggests the market has already washed out the pure spec layer, and what's left is demand anchored to protocol revenue and activity. When usage metrics keep compounding (and the team is guiding toward doubled attestation volume and 100 million wallet reach), the token starts behaving less like a narrative bet and more like a utility with built-in absorption capacity.
Of course I have to flag the counterpoint, because ignoring it would be sloppy. Wallet concentration on the backer side is still high, and if a handful of large holders decide to exit in lockstep after April 28, the velocity could temporarily flip from absorber to amplifier. We've seen that movie before. Plus, some of those 40 million wallets are one and done recipients who might never touch the token again. If the daily active distribution volume stalls or attestation counts flatten, then yeah the liquidity story was just noise.
But here's how I'll know the thesis is playing out in real time. Over the next 60 to 90 days, post-unlock, I want to see 24 hour volume hold above 1x the new expanded market cap, on-chain distribution runs continuing to scale, and price stabilizing without cratering below the recent lows. That combination would tell me the usage flywheel is structural, not temporary. The opposite volume cratering to sub 0.5x and attestations going flat would mean I was wrong and the dilution math wins.
I'm not here to hype or call a bottom. I'm just sharing what the numbers are showing me after weeks of watching the same patterns repeat: SIGN isn't waiting for adoption anymore. It's already inside the loop, and the April unlock might be the moment the rest of the market is forced to notice. The data is public, the test window is narrow, and I'm paying close attention..