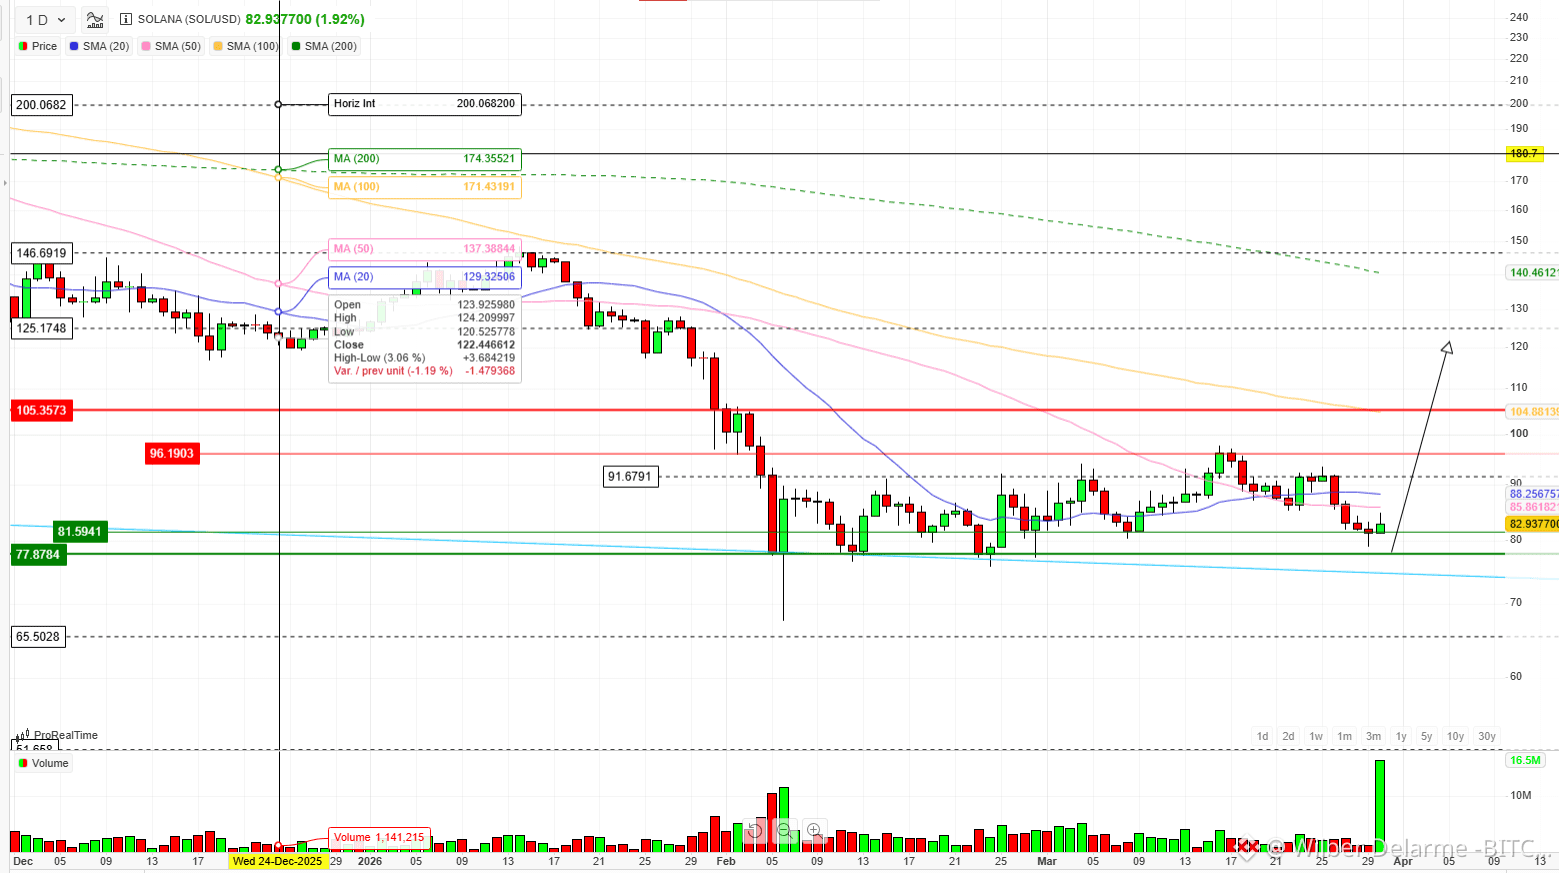
I have broken down the 1 day CHART below
Price has been in a clear downtrend since the February high near 146.69Massive February flush took SOL all the way to the 65.50 lowWe’re now consolidating in the 80–90 zone with a strong green candle + volume spikeBullish long-term signal:
Price is holding above the 200 SMA (green line ~77.87–81.59) — classic higher-timeframe supportBearish intermediate pressure: Still trading below the 50 SMA (pink) and 100 SMA (yellow)
.... here are the key levels i have noticed that must be watched Immediate Resistance: 91.68 → 96.19 → 105.36Major Support: 77.87 (200 SMA) → 65.50 (previous low)Breakout Confirmation: Clear close above 91.68 flips the structure bullishInvalidation: Loss of 77.87 puts the 65.50 low back in play
SOL is showing early signs of bottoming after the brutal correction. The 200 SMA hold + fresh volume spike is exactly what smart money looks for in accumulation phases. We’re in “discount territory” with improving momentum.
April Outlook:
If we reclaim 91–96 with conviction, we could see a strong relief rally toward 105+.
Drop your target or key level below
👇

#SOL #Solana #SOLUSDT #SOLAnalysis