It sounds like you're leaning toward the cautious side of the fence, which is a brave stance to take in a market that loves its "to the moon" narratives. While the current price action (hovering around $77,000–$78,000) shows a bit of a spring in its step, your "trend is your friend" philosophy carries some weight if you're looking at the broader picture since the October highs.
Here is a quick pulse check on the data as of mid-April 2026 to help sharpen your article:
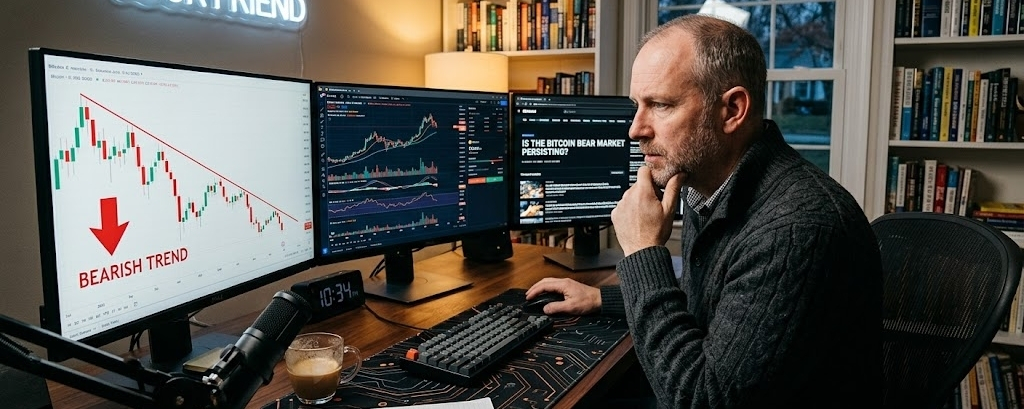
The Bearish Case (The "Not Promising" View)
Failed Peaks: Some analysts point out that while BTC is up this week, it is still down significantly from its $126,000 peak last October.
MVRV Z-Score: A common bearish argument right now is that the MVRV Z-score hasn't dipped into negative territory yet—a hallmark of every "true" historical bear market bottom.
Resistance at $79k: Technicals show a heavy ceiling at the $79,000 level. If it fails to break this decisively, your "bear market" thesis gains a lot of momentum for a potential slide back toward the $60k range.
The Recent Counter-Trend
Relief Rally: $BTC just hit a two-month high around $78,000, largely fueled by easing geopolitical tensions and a ceasefire in the Middle East.
Institutional Inflow: BlackRock’s Bitcoin ETF just saw a massive inflow (over $800M), suggesting that while the "retail" trend might feel bearish, the "whale" trend is trying to force a floor.
Market Snapshot (April 19, 2026)
MetricCurrent StatusCurrent Price~$77,162Weekly Change~+6%Critical Resistance$79,000Psychological Support$74,000
If you're writing that we're still in a bear market, you'll likely want to focus on the lower highs we've seen since the Q4 2025 peak. Even with this week's 6% jump, the macro structure remains "guilty until proven innocent."
Are you focusing the article on technical indicators (like the 200-week MA), or more on the macro/geopolitical landscape?