Buying near support
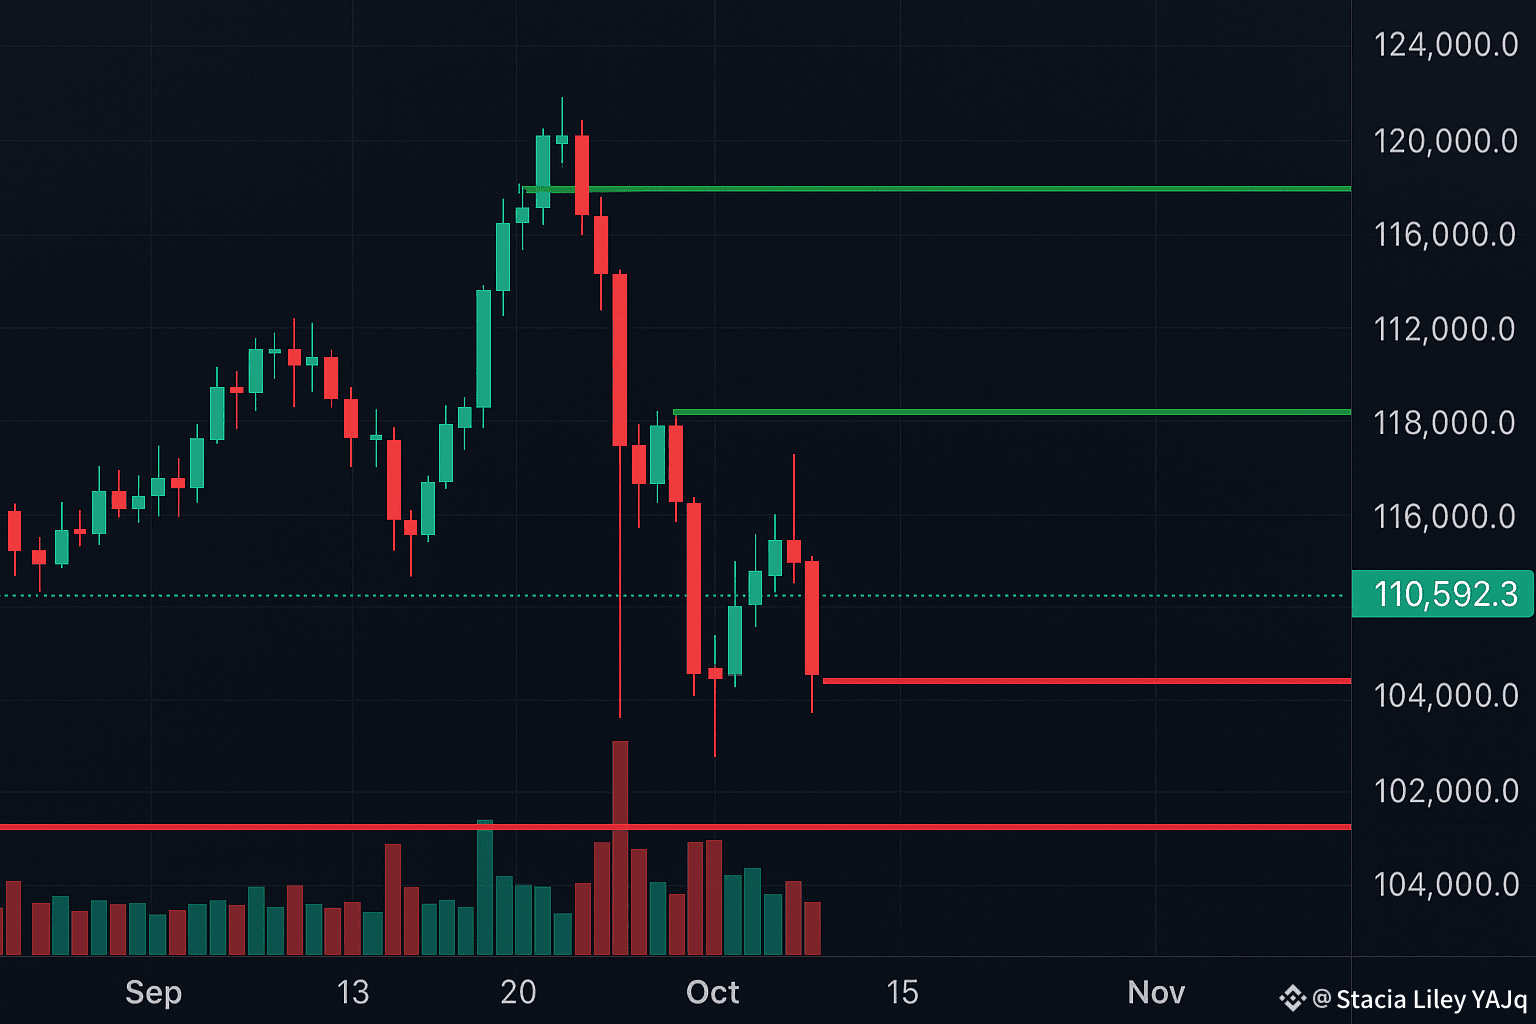
Wait for price to come close to the support zone (around $108k in this chart).
Look for a green candle or a small reversal pattern (a sign the buying pressure is returning).
Place a stop-loss just below support (so one bad day doesn’t wipe you out).
Aim to take profit near the next resistance level (for example $112.5k).
Selling near resistance
If price moves up toward the resistance zone ($112.5k–$116k), watch for rejection signs — long wick candles, quick reversals, or volume drops.
Place your stop-loss a bit above that resistance, and target the support area for profit-taking.
Use indicators to confirm
Indicators aren’t magic, but they help:
RSI — if it’s high (near 70), price may be overbought; if it’s low (near 30), it may be oversold.
EMA 20 & 50 — if price is above them, the short-term trend is bullish; below means bearish.
Volume — big volume on a breakout makes it more believable; low volume breakouts are more likely to fail.
#