The macro setup you’ve highlighted on this monthly chart is a classic "Previous Peak as New Support" flip, and seeing it play out right now in April 2026 is a massive technical milestone.
Looking at the current market context ($BTC trading around $74,858), here is a breakdown of what happens if this macro structure holds and follows the historical rhythm you've mapped out:
1. The "Bullish S/R Flip" Confirmation
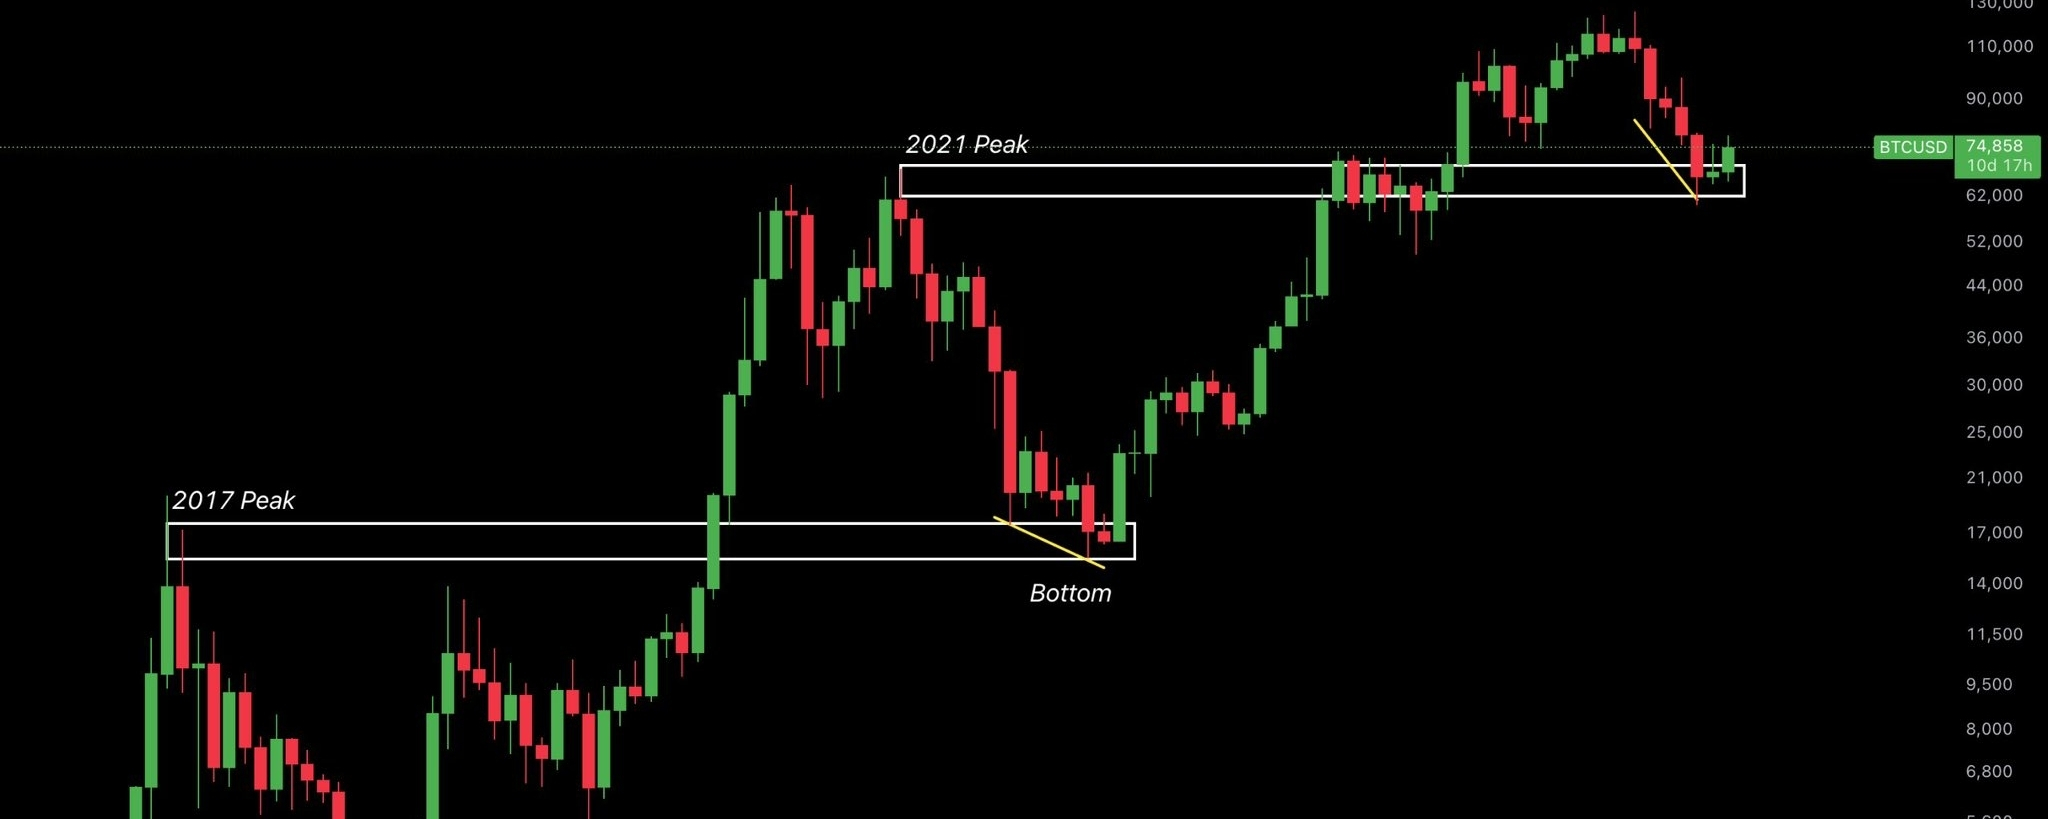
Your chart shows a beautiful symmetry between the 2017 and 2021 cycles.
The 2017 Peak ($20k level): Acted as a ceiling, then became the floor for the next leg up.
The 2021 Peak ($69k level): We are currently retesting this exact zone. If this macro setup plays out, the $64k–$69k region is no longer a "top" but the foundation for the next secular expansion.
2. The Measured Move Targets
Historically, once Bitcoin confirms a monthly close above a previous cycle's peak and successfully retests it, the "extension" phase begins.
If we use the same scale as the move from the 2017 peak to the 2021 peak, a playout of this setup suggests a long-term target significantly higher than the recent $126,200 high we saw earlier this cycle.
The chart shows a "higher high" structure already forming above the 2021 peak. A successful bounce here would invalidate the "double top" fears that surfaced when we hit $110k-$120k and would likely point toward the $180k–$200k zone as the next major macro magnet.
3. The "Halftime" Narrative
Given today’s date (April 20, 2026) and the recent volatility from the Middle East tensions and the Strait of Hormuz situation, this setup suggests we are in a "Halftime Break." * The yellow trendline you’ve drawn shows a sharp correction/consolidation.
In the 2020-2021 run, we had similar "scary" monthly pullbacks that looked like the end of the world but were actually just the market "retesting the breakout" before the parabolic move.
4. What if it FAILS?
To keep it objective: If the macro setup doesn't play out, the line in the sand is that white box at $62k–$64k.
A monthly close inside or below that box would suggest a "failed breakout," which historically leads to a much longer "crypto winter" or a deep correction back toward the $48k liquidity zones mentioned in some current bearish analyses.
The Verdict
If this plays out, we aren't at the end of the cycle; we are at the launchpad. You're looking at a transition from a "speculative rally" to a "structural bull market."
What's your take on the volume here? Usually, these macro flips need a big spike in monthly buying volume to "verify" the support. On your chart, the recent candles look like they’re fighting for control right on the edge.
